The Cat Doctor is a trusted source for feline medicine in Atlanta. They have been around since the late 80’s - in fact, when they first opened, they were using typewriters to create prescription labels!
On November 1st, 2019, I was hired to help them gain a deeper understanding of their clients, discover new areas of improvement, and implement any changes needed.
The biggest problem we found is that cat owners need to make informed decisions regarding their feline friend’s well being but are unaware of their own misperceptions about cats. This is made more complicated by the fact that cats are genetically programmed to hide any signs of illness or injury, yet benefit from annual medical care as much as dogs and humans do.
Since the problem centers around education and cat owners may not be aware of it, we began developing an online learning center with interactive tools and articles covering common cat health misperceptions. Other potential future options include short videos, weekly tips and tricks, and quizzes.
- My deliverables have been used to drive ad conversion rates up 36%.
- Of those that click the ads, 70% now go on to make appointments.
- After launching the online learning center, we noticed a 12% increase in current clients coming back.
Secondary Research Paper
Secondary Qualitative Accounts
Surveys
Affinity Mapping
Personas
Google Mapping Sheets
Problem Statement
Severity Ranking
Journey Mapping
Content Strategy
Prototyping
MVP
Usability Testing
A/B Testing
Usability Testing
|---------------------------------------------------------- 2 weeks ----------------------------------------------------------|
The goal of our discovery research centered around this question. We hypothesized that there was some deviation in annual visits amongst clients with similar financial abilities and similar cats, but we didn’t know why this deviation would exist. While I was not able to talk to Cat Doctor clients at the start of my employment, I did have access to research and articles by the American Veterinary Medical Association (AVMA), the American Association of Feline Practitioners (AAFP), and 30 years worth of quantitative Cat Doctor client data.
Below is a summary of some of my findings from the AVMA and the AAFP. We kept this information in mind when we began sifting through client data.
In the
2017-2018 U.S. Pet Ownership & Demographics sourcebook, the AVMA reported a disparity between cat veterinary visits and dog veterinary visits:
DOGS
CATS
Percent of US households owning:
25.4%
38.4%
Average number owned per household:
1.8
1.6
Veterinary visits per household per year (mean):
1.3
2.4
In 2013, the AVMA published an article reporting a number of perception issues surrounding cats:
- Owners assume indoor cats are protected from diseases.
- Nearly 40% of cat owners do not think their cats need yearly veterinary visits.
- 70% of cats were acquired for free which is seldom true for dogs.
- There is a correlation between decrease in frequency of pet visits and increase in incidences of preventable pet diseases.
The AAFP solutions brochure (not available to the public) cited more perception issues:
- 51% of clients percieved cats as low maintenance.
- 70% of clients are not convinced that cats hide symptoms.
- 81% of clients believe their cats are in excellent health and self-sufficient.
- 83% of cats are brought to veterinarians within the first year of ownership. Over half do not return.
- Many clients don’t understand that cats are genetically programmed to hide signs of illness and injury.
After creating a research document and sharing my findings, we started analyzing 30 years worth of quantitative data using Google Sheets. Looking at differences between owners that visited more often than others, owners that had a cat with a chronic condition vs not, distance from the cat doctor, age, weight, average spent per year, and so on.
Early on, I noticed some gaps in our data. We were sifting through 30 years worth of quantitative information and had very little qualitative. Since I was not able to talk to clients face-to-face, I convinced my PM to let me create a survey using Cognito Forms (we had an NPS survey running at the same time but we needed more specifics). We also enlisted the help of the Cat Doctor's daily operation manager for secondhand qualitative information and I interviewed a few cat-owning friends about their current veterinary care. We were searching for information regarding how clients viewed their cat, what they looked for in veterinarians, what pain points they had in regards to vet visits, the first steps they take when their cat has a medical problem, and how they related to the AVMA and AAFP information.
Affinity Mapping the cognito survey and secondary qualitative data revealed that within Cat Doctor clients, there exists a group that strongly view their cat as family, have the means to pay for its care, yet don't visit as often as recommended. Our assumption at this point became if clients strongly view their cat as family and have the means to pay, then the reason they don’t visit as much as recommended is because of a misperception about cat healthcare. Other pain points uncovered centered around cost and living with someone unenthusiastic about cats.

The first affinity map for this project. The colors correlate to how strongly clients agree with the statement "my cat is like my child." Within that they are separated between how often they visit the Cat Doctor and then further divided by their willingness to pay.
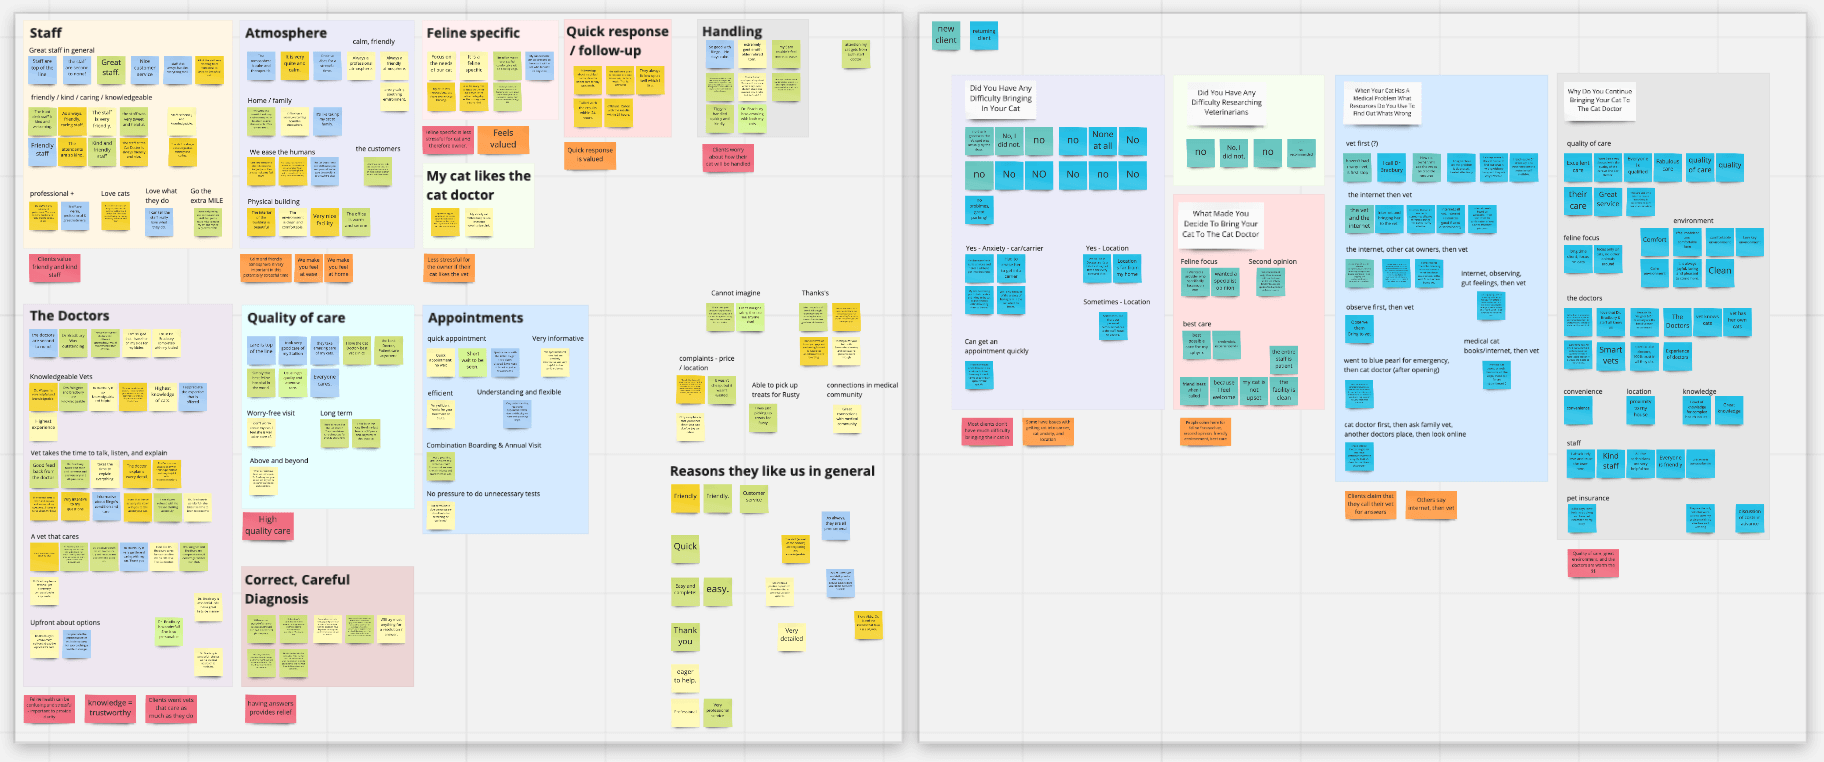
My second affinity map, comparing our NPS and Cognito surveys.
My second affinity map compared the Cognito Survey with our NPS survey. I looked for similarities between why new clients decided to come to the Cat Doctor and why returning clients kept coming back. Analyzing this data revealed the most important reason was they wanted "a veterinarian who answers my questions."
To take this data a step further, and out of curiosity, I decided to see if there were any trends between client locations and how often they visited. Using google mapping sheets, I created an interactive map showing where great clients and good clients live. This revealed that the majority of clients live within a “diamond” shape. Previously, ads had been targeting people within a 25 mile radius of the Cat Doctor. Using this map, my PM reduced the radius and focused on targeting people within this diamond.
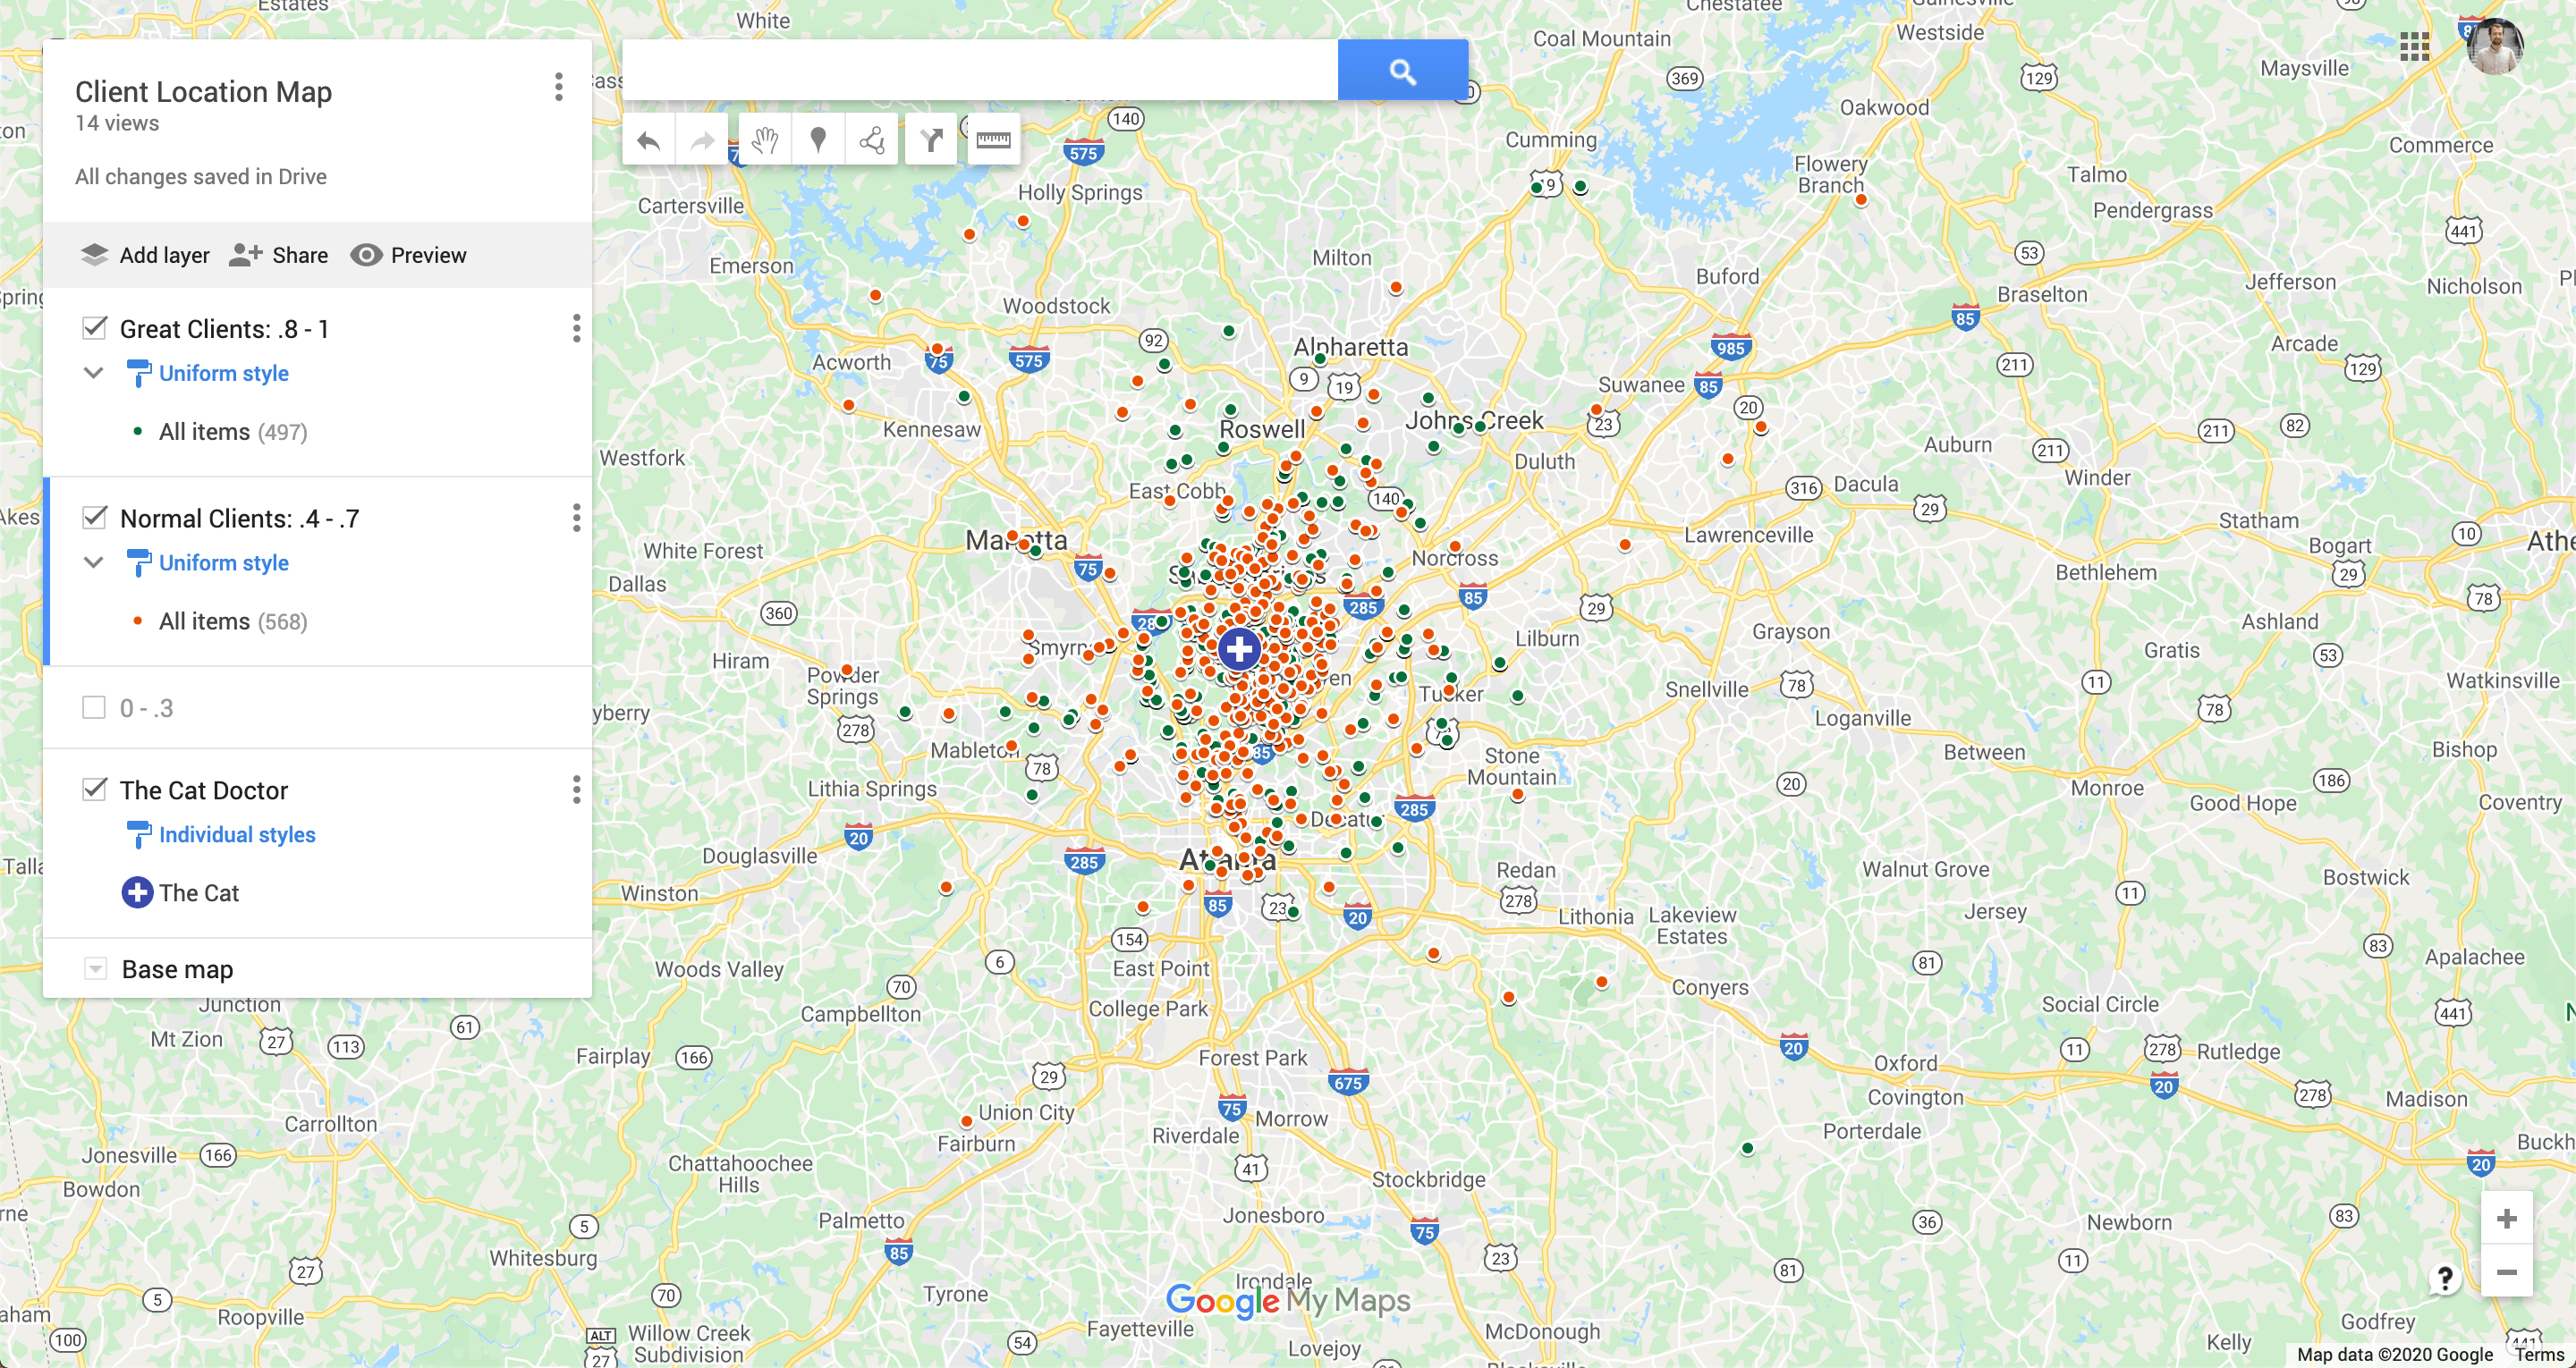
Within the first week of reducing the ad radius, conversion rates went up 6%. Once we combined this map with data from our surveys, ad conversion rates went up 36%. Now that we were targeting the right people in the right way (i.e. presenting the Cat Doctor as a "veterinarian who answers my questions") the rate of people making appointments after clicking on our ads went up to 70%.
With our clients motivations and pain points better defined, I created our personas. We settled on dividing the client data between their "visit ranking" (i.e. how often they visit) and whether or not they owned a cat with a chronic condition. Cats with a chronic condition often require more veterinary visits, so we were curious if there were disparities within this group and how they compared to clients owning cats without a chronic condition.
To sum our research up, we found the main problem to be:
Problem: Cat owners need to make informed decisions about their feline friend’s well being but are unaware of their own misperceptions about cats.
Why do these misperceptions exist? Historically speaking, views of cats have oscillated between deification (ancient Egypt) and demonization (the middle ages). Cats in rural areas were often thought of as expendable tools, used to keep vermin populations in check. Today however, research shows that younger generations are more likely to view their cat as family than older generations. As we go through the rest of this case study, ask yourself: through what lenses do I view these creatures?
While these misunderstandings manifest in many different ways, we chose to focus on a select few. We believe that these present the Cat Doctor with the best opportunities.
“My cats weight is fine”
Cat obesity is a major concern for indoor cats. Just like humans, prolonged obesity can lead to serious health conditions like diabetes and arthritis. According to the AAFP, 58% of cats in the US are overweight or obese. Amongst Cat Doctor clients, this number is 40%. A healthy weight for domestic cats is around 10 lbs (although it can vary depending on breed). If we take into account that 1 lb for a cat is equal to 15 to 17 lbs for a human, then a cat being 5 lbs overweight is similar to a human being 75 to 85 lbs overweight!
“I think my indoor cat is invincible.”
Obesity aside, other potential threats for indoor cats include parasites, dental disease, and, of course, old age. As cats age, they become more susceptible to issues like kidney disease and heart disease - just like humans.
“Annual visits are a waste of money and time.”
Cats age much more rapidly than humans, so annual visits are incredibly important. The first year of a cats life is similar to the first 25 years of a humans life. After that, 1 human year is roughly equal to 4 cat years. Within Cat Doctor clients, data showed that cats with consistent annual visits live an average of 3 years longer than cats without. This is further backed up by research done by Dr. Ron Dehaven (AVMA CEO), who says there is a direct “correlation between decrease in frequency of pet visits and increase in incidences of preventable pet diseases.”
“Dr. Google is all I really need.”
How much do you trust the internet in regards to your own health? While google can be helpful for understanding certain conditions, it is not the best tool for making an official diagnosis. However, there is an opportunity here to point clients in the direction of the right information.
Now that we had a good grasp of the issues and misperceptions surrounding cat healthcare, we knew that the solution to our problem was education based. So how do we fix a problem that our users don’t know they have?
Our first step was to create an article detailing the importance of annual visits. This article can be
read here.We kept in mind a number of content strategy tips when designing this article:
- People will probably scan, so visuals are important.
- Don't expect readers to make it through the whole article, so have the most impactful information at the beginning.
- According to the book "100 Things Every Designer Needs To Know About People," by Susan M. Weinschenk, when users read online they prefer a shorter line length (45 to 72 characters per line) but they read faster with a longer line length (100 characters). Since we weren't expecting people to read our whole article, we opted to give them what they prefer.
For the next addition to the online learning center, we wanted something engaging and personal that our clients could interact with. What initially started as a quiz quickly grew into a sort of online diagnostic tool. Our hope for this tool is that it will help clients make more informed decisions about their cat's wellbeing.
The first step towards creating this was developing questions. These questions had to be something that clients could easily answer yet provide us with enough details so that we could offer informed suggestions. For that, we needed a blend of what clients could see or check in their own homes and what veterinarians do during exams.
Below are examples of how a few of our questions changed based on veterinarian feedback and user feedback:
How are your cat's kidneys?
Have you noticed any abrupt changes in your cat’s food or water consumption?
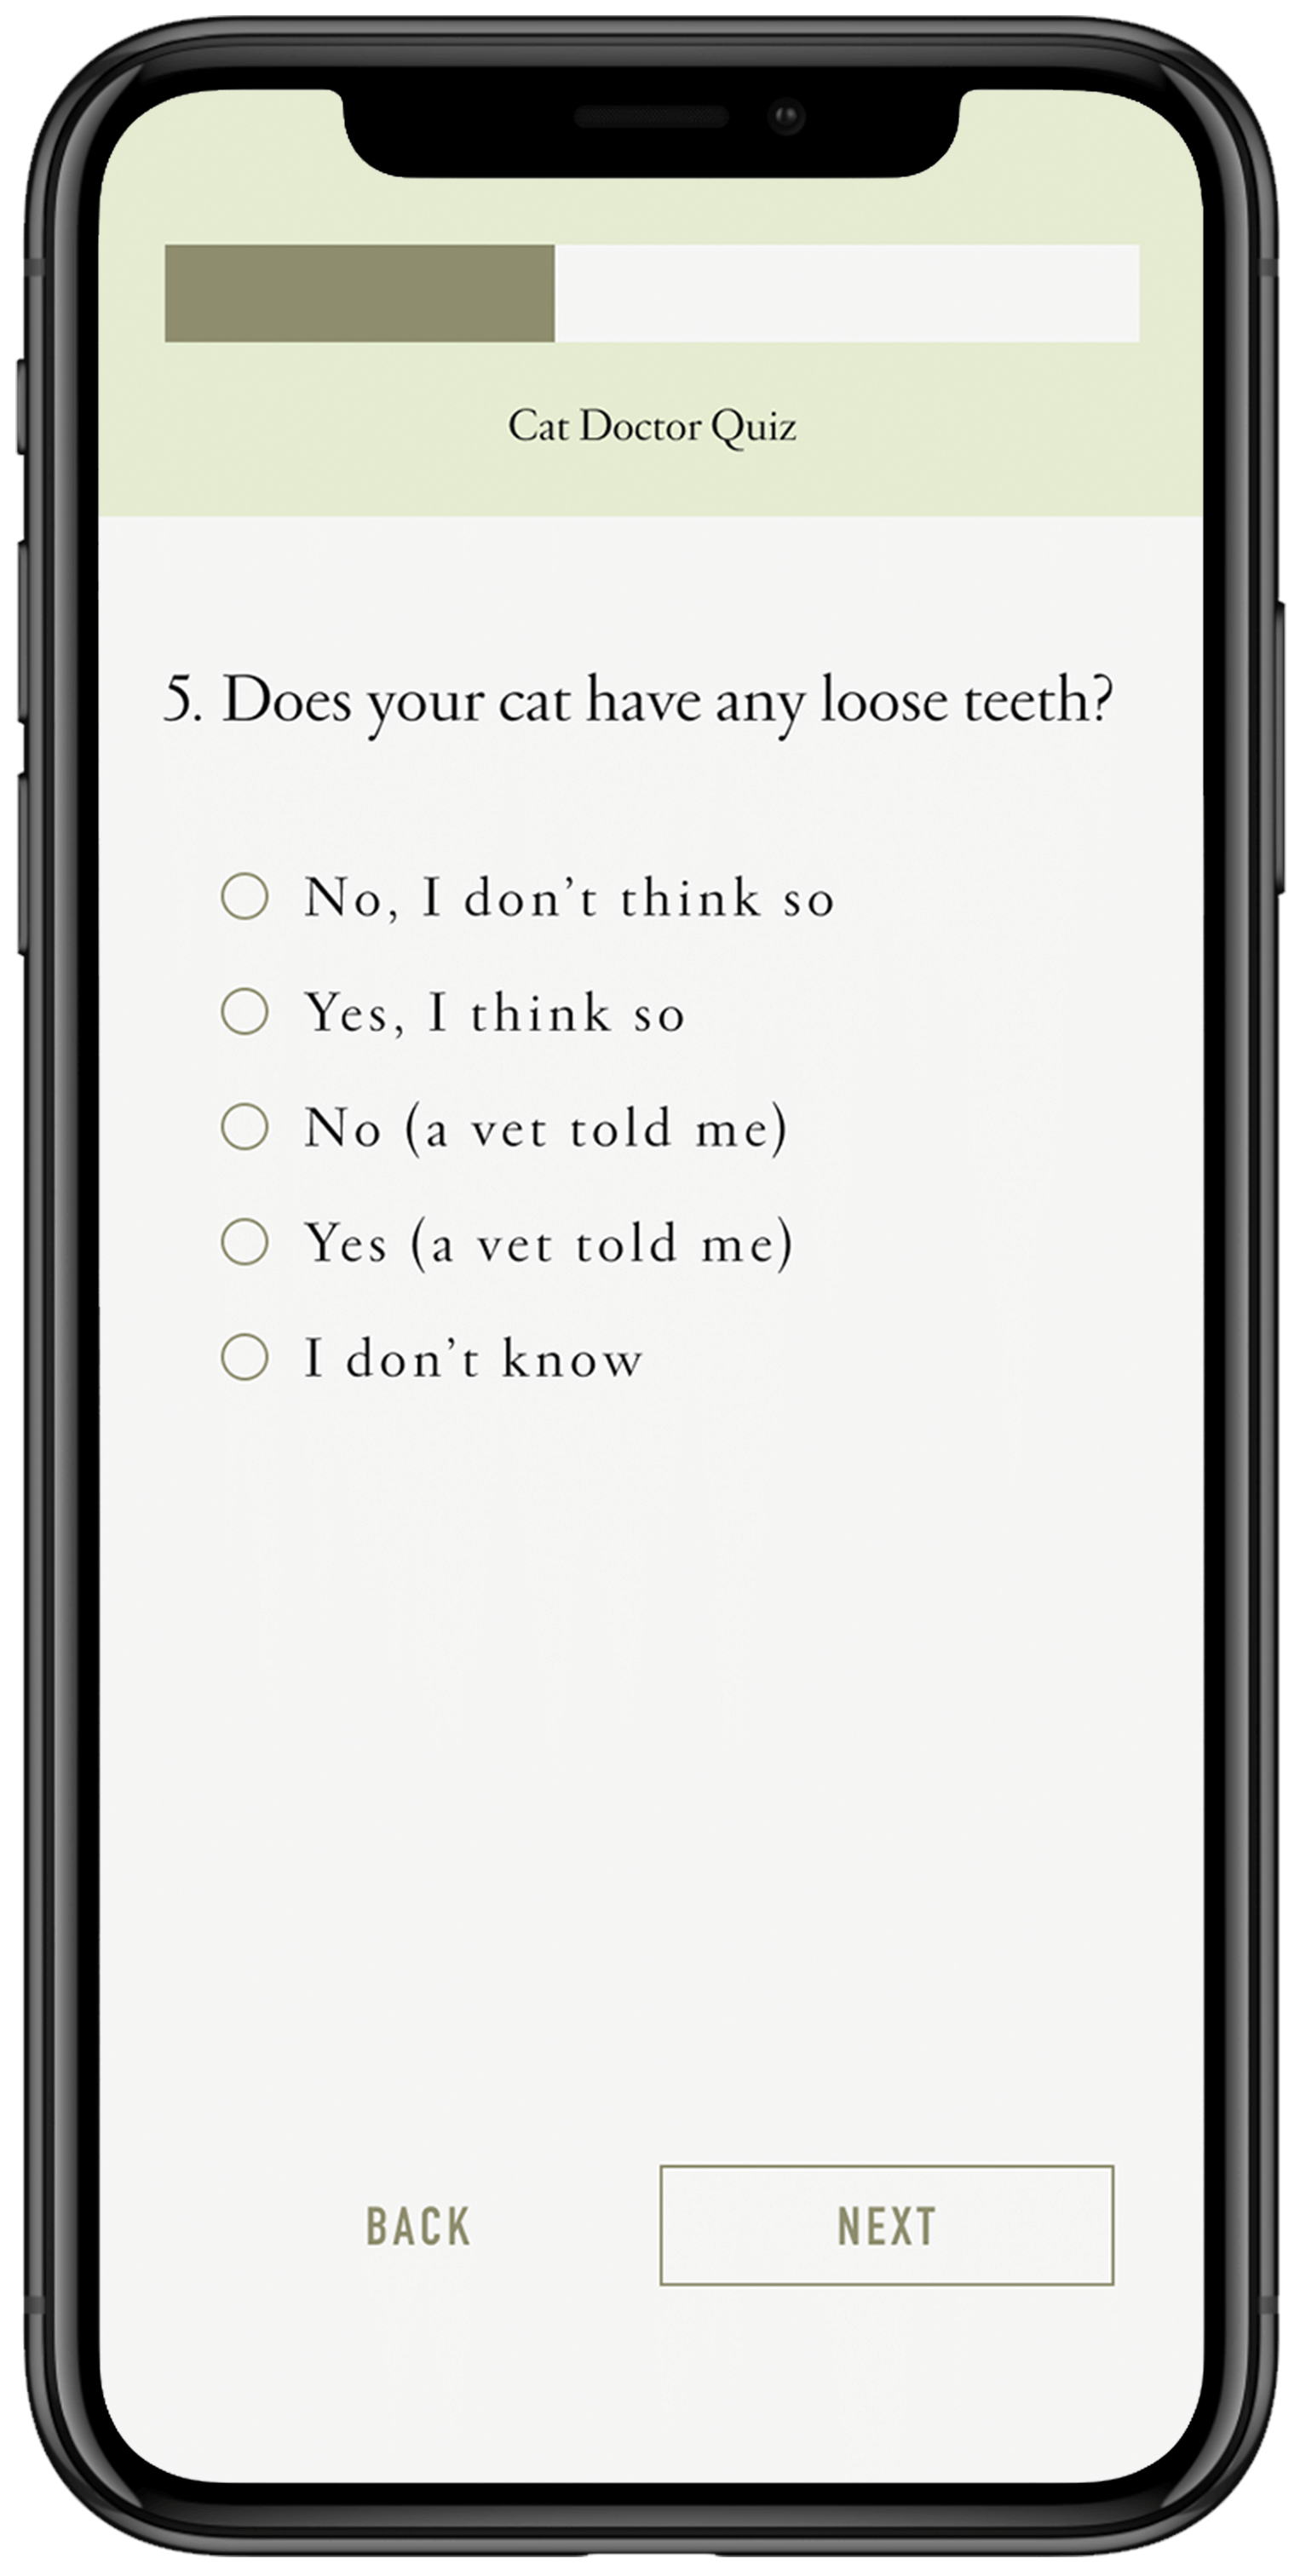
How are your cat's teeth?
What color are your cats gums?
How would you describe your cat's energy level?
Have you noticed any abrupt changes in your cat’s jumping abilities?
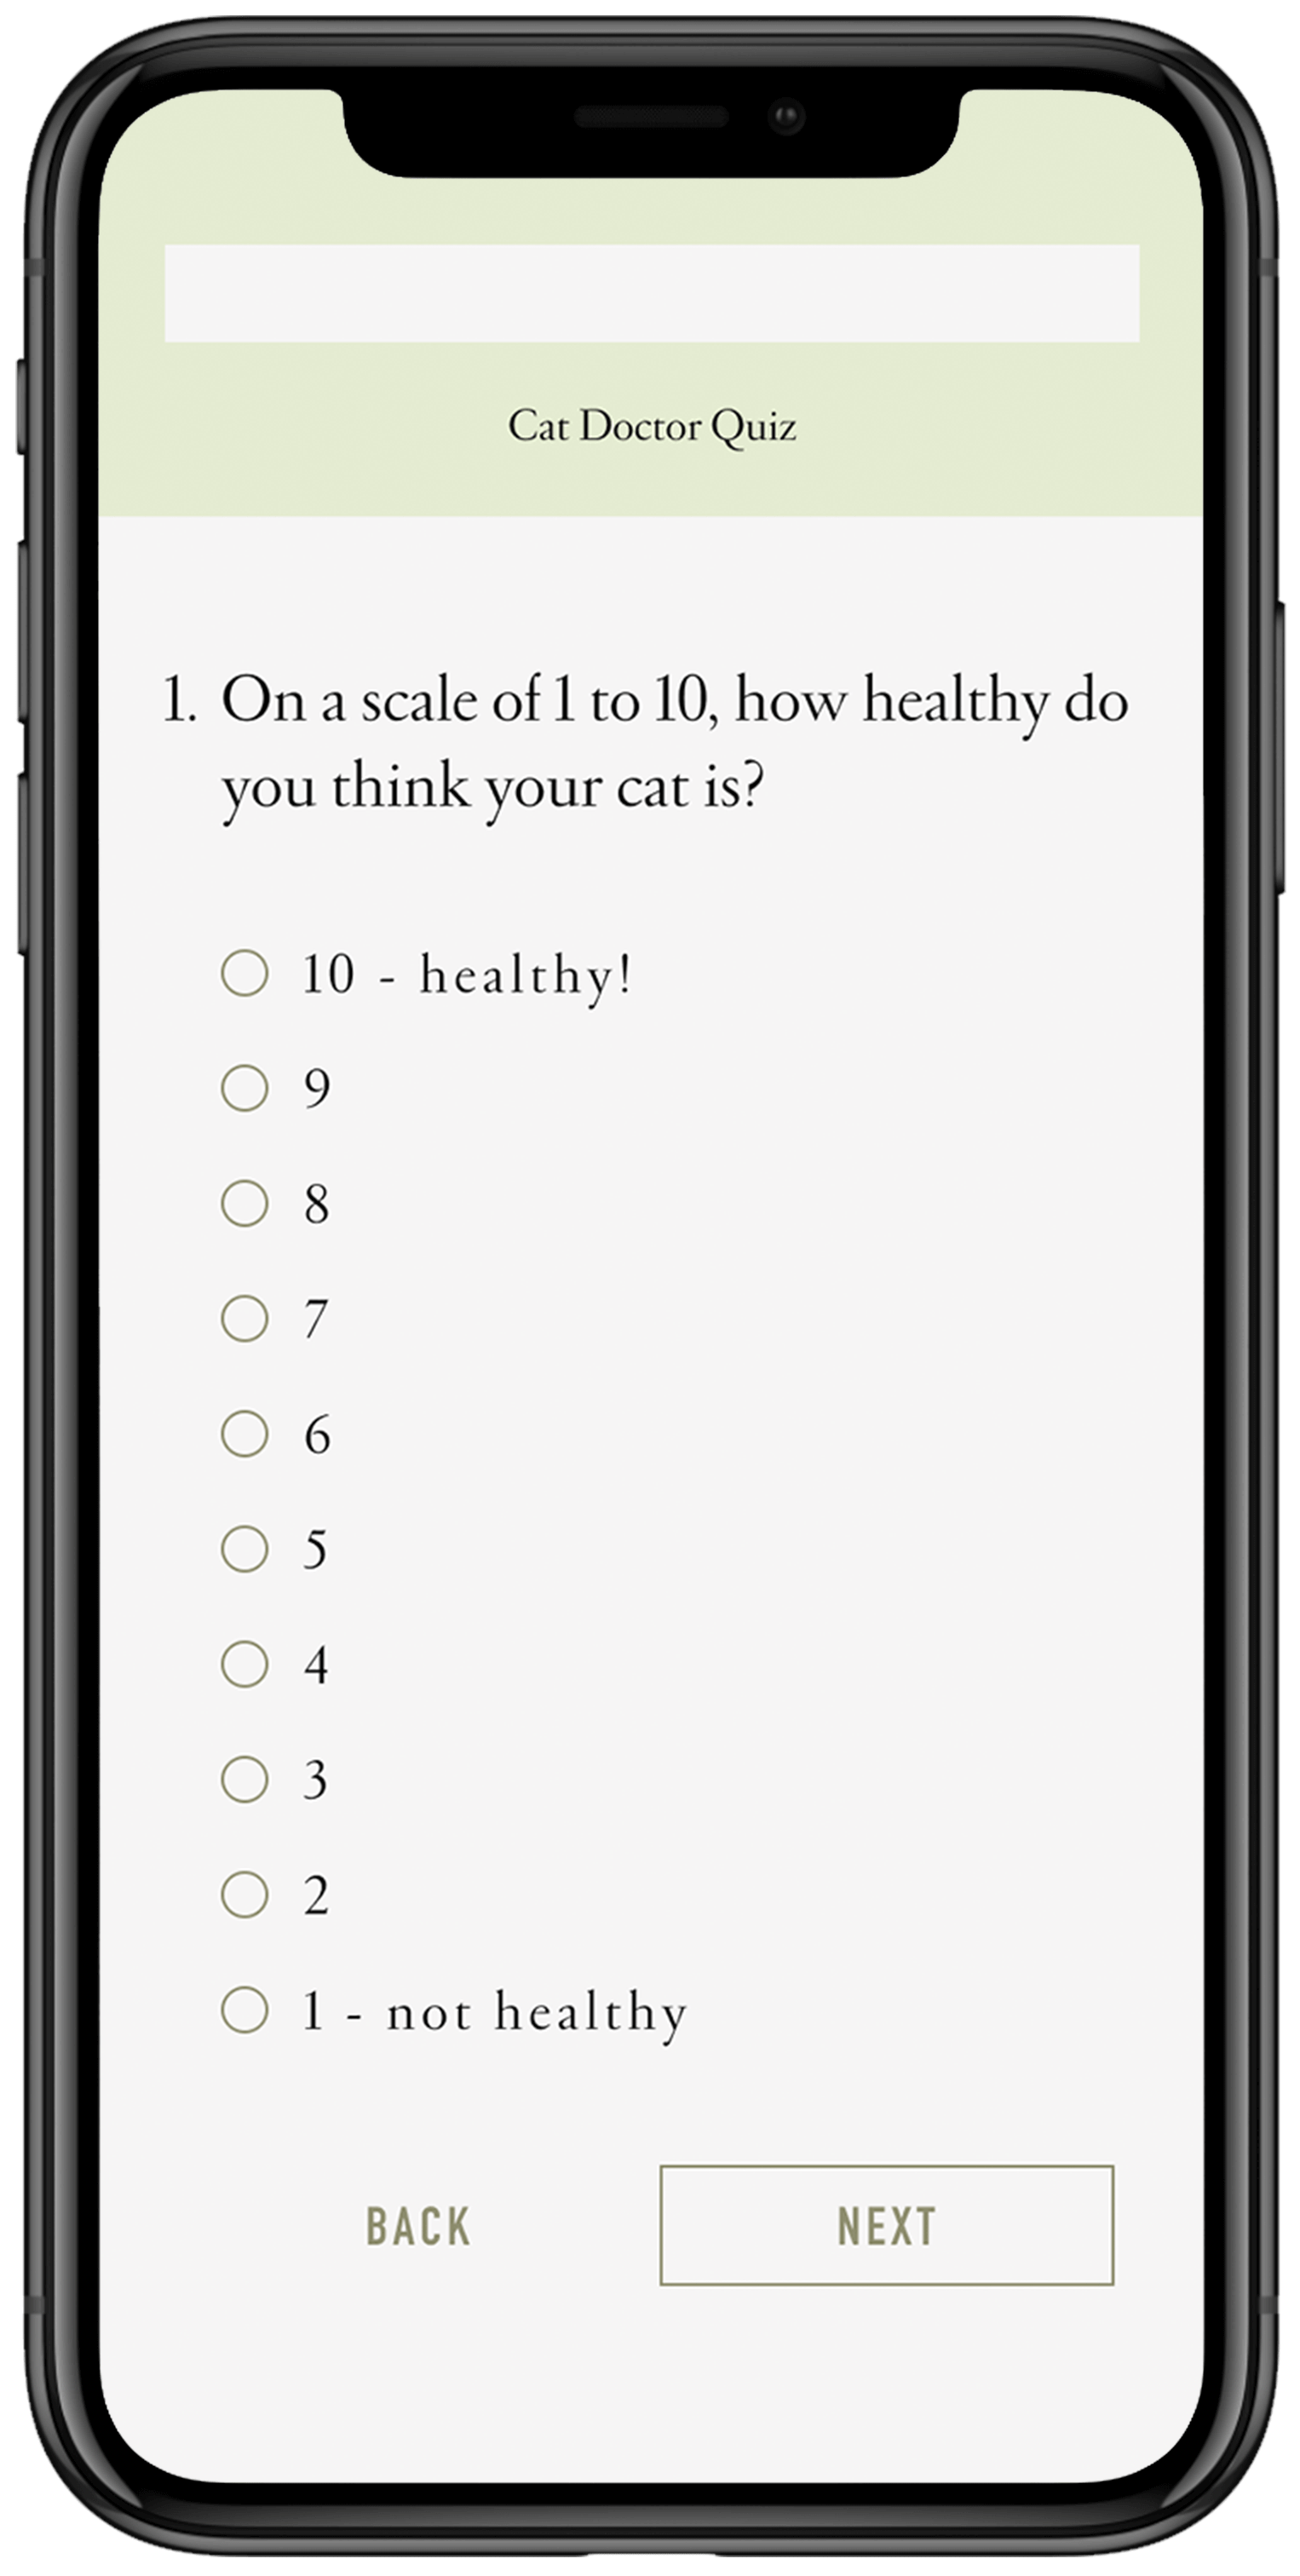
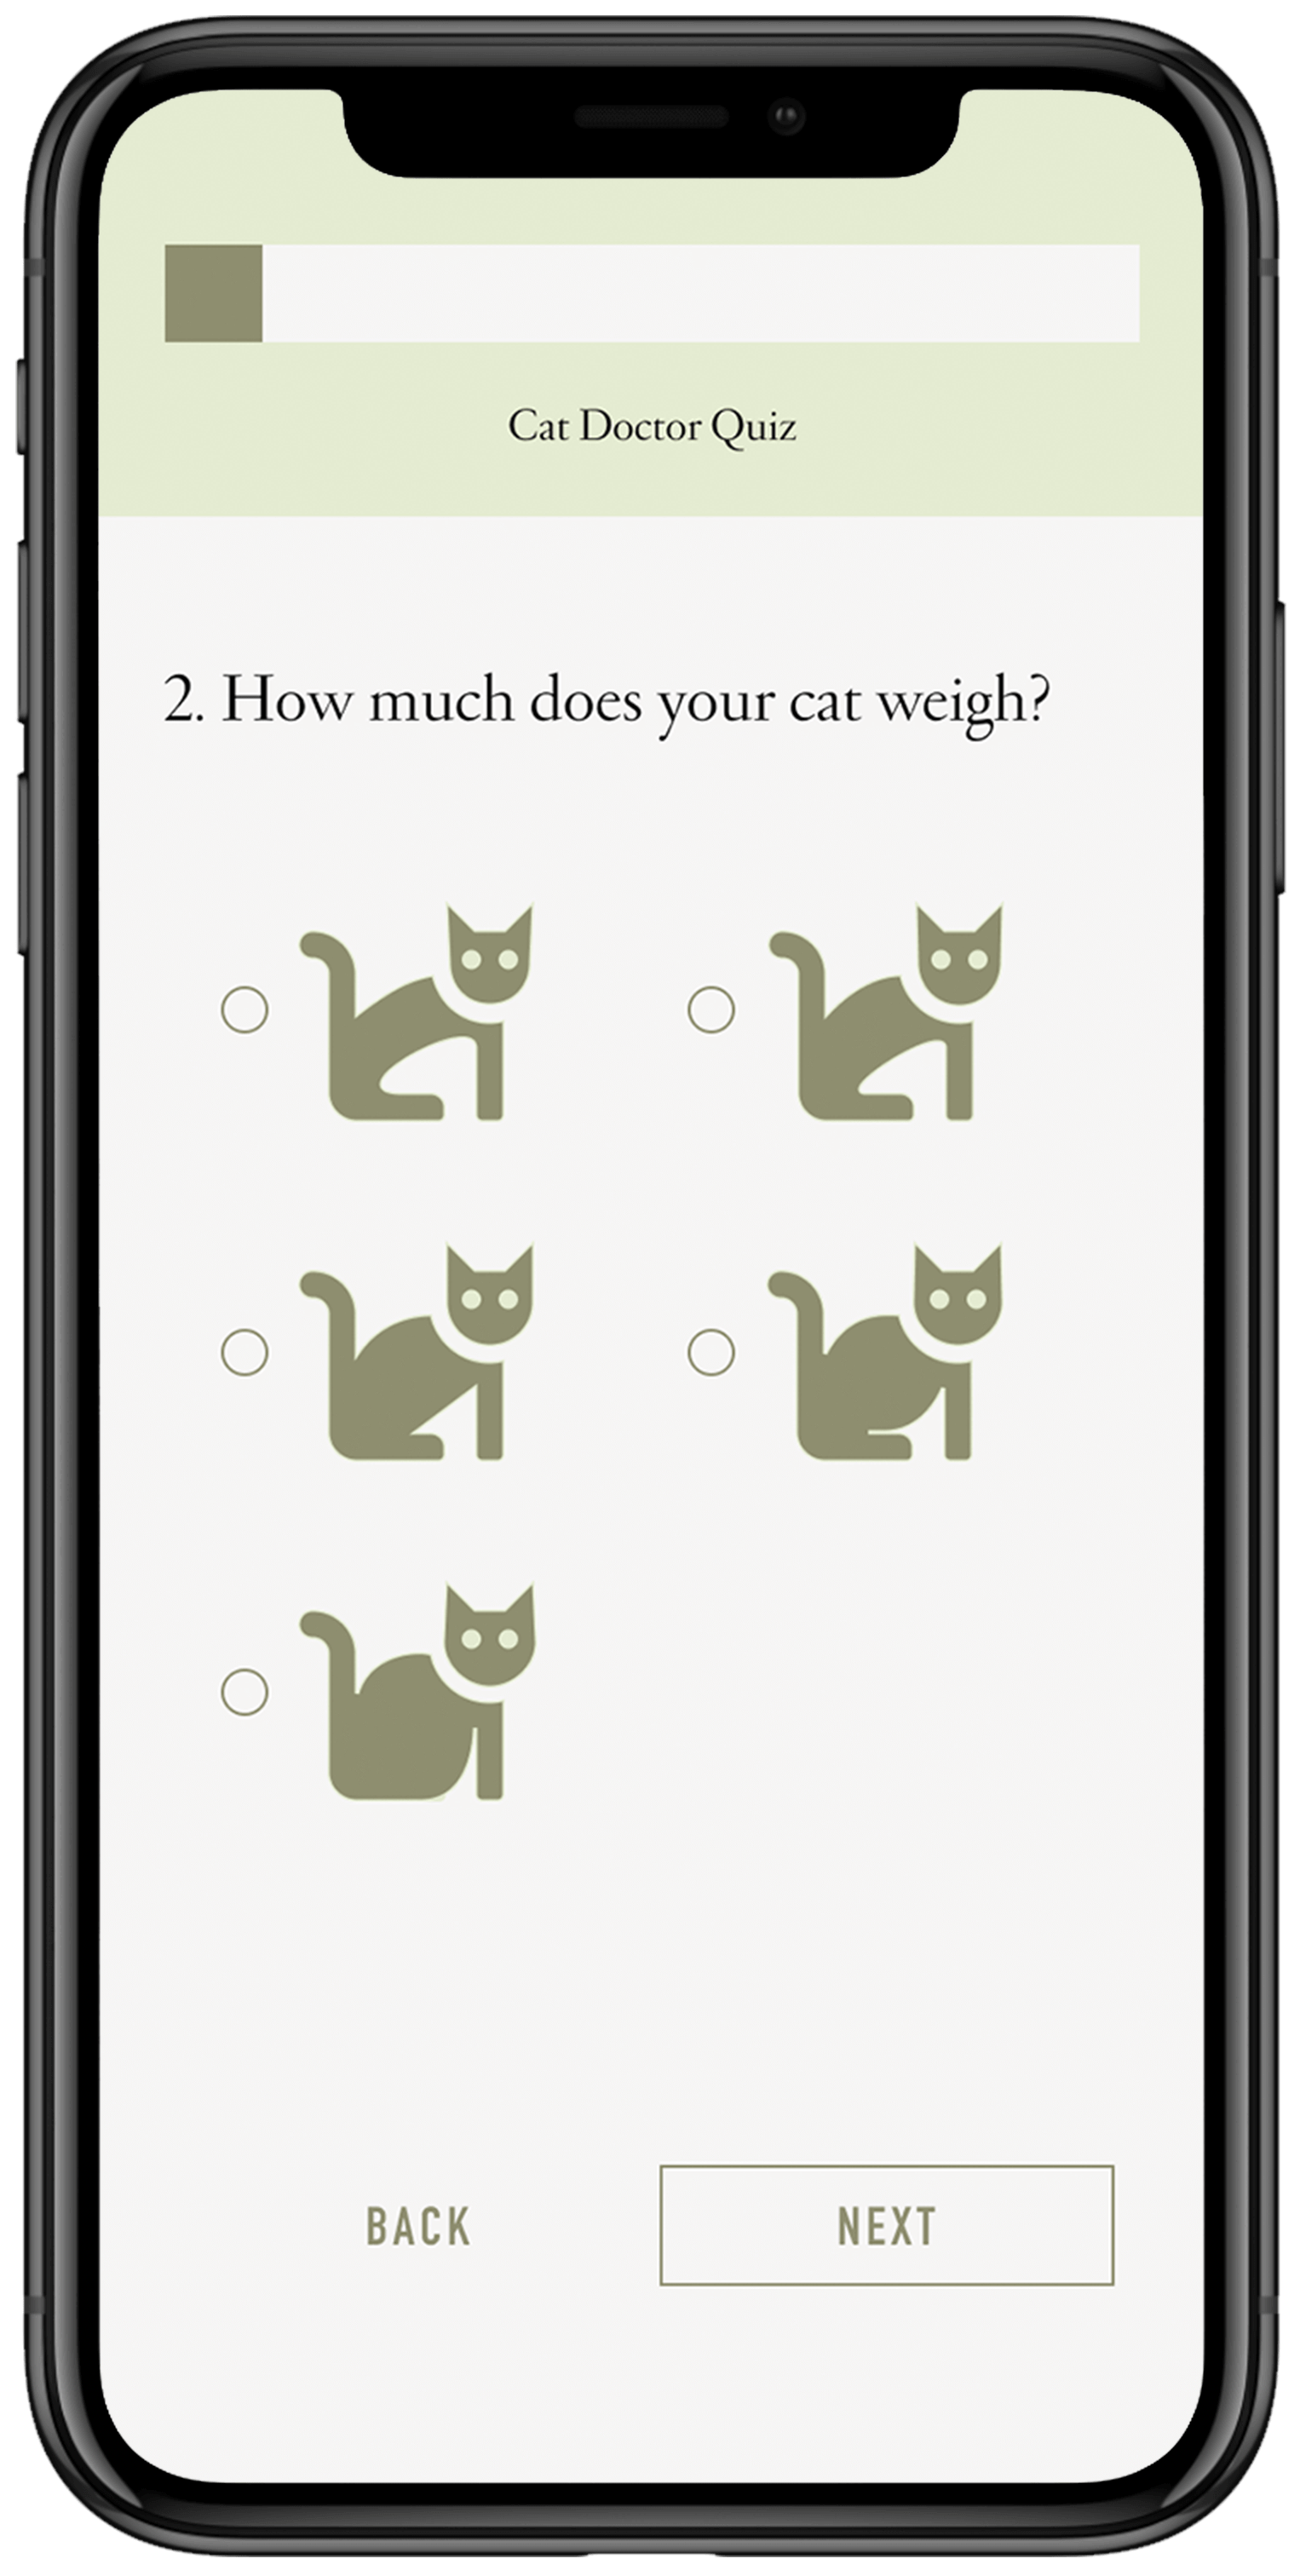
When combined, the answers to these questions can help us paint a good picture of a cat's overall wellbeing. After testing early versions of my designs, we noticed that asking for very specific answers proved difficult for our users. We decided that we didn't need to know exact weight, or exactly how often a cat vomited or coughed up hairballs, but we needed an estimate. So almost all of the questions became sliding scales, offering an easier and interactive solution while still providing us with pertinent information.
I used an 8 column grid with 10px margins and gutters. The images below show how my designs evolved as I implemented user feedback and stakeholder suggestions. This ideal version features 11 questions and would include personalized feedback at the end of the questionnaire.
Question 1
wireframe
first mockup
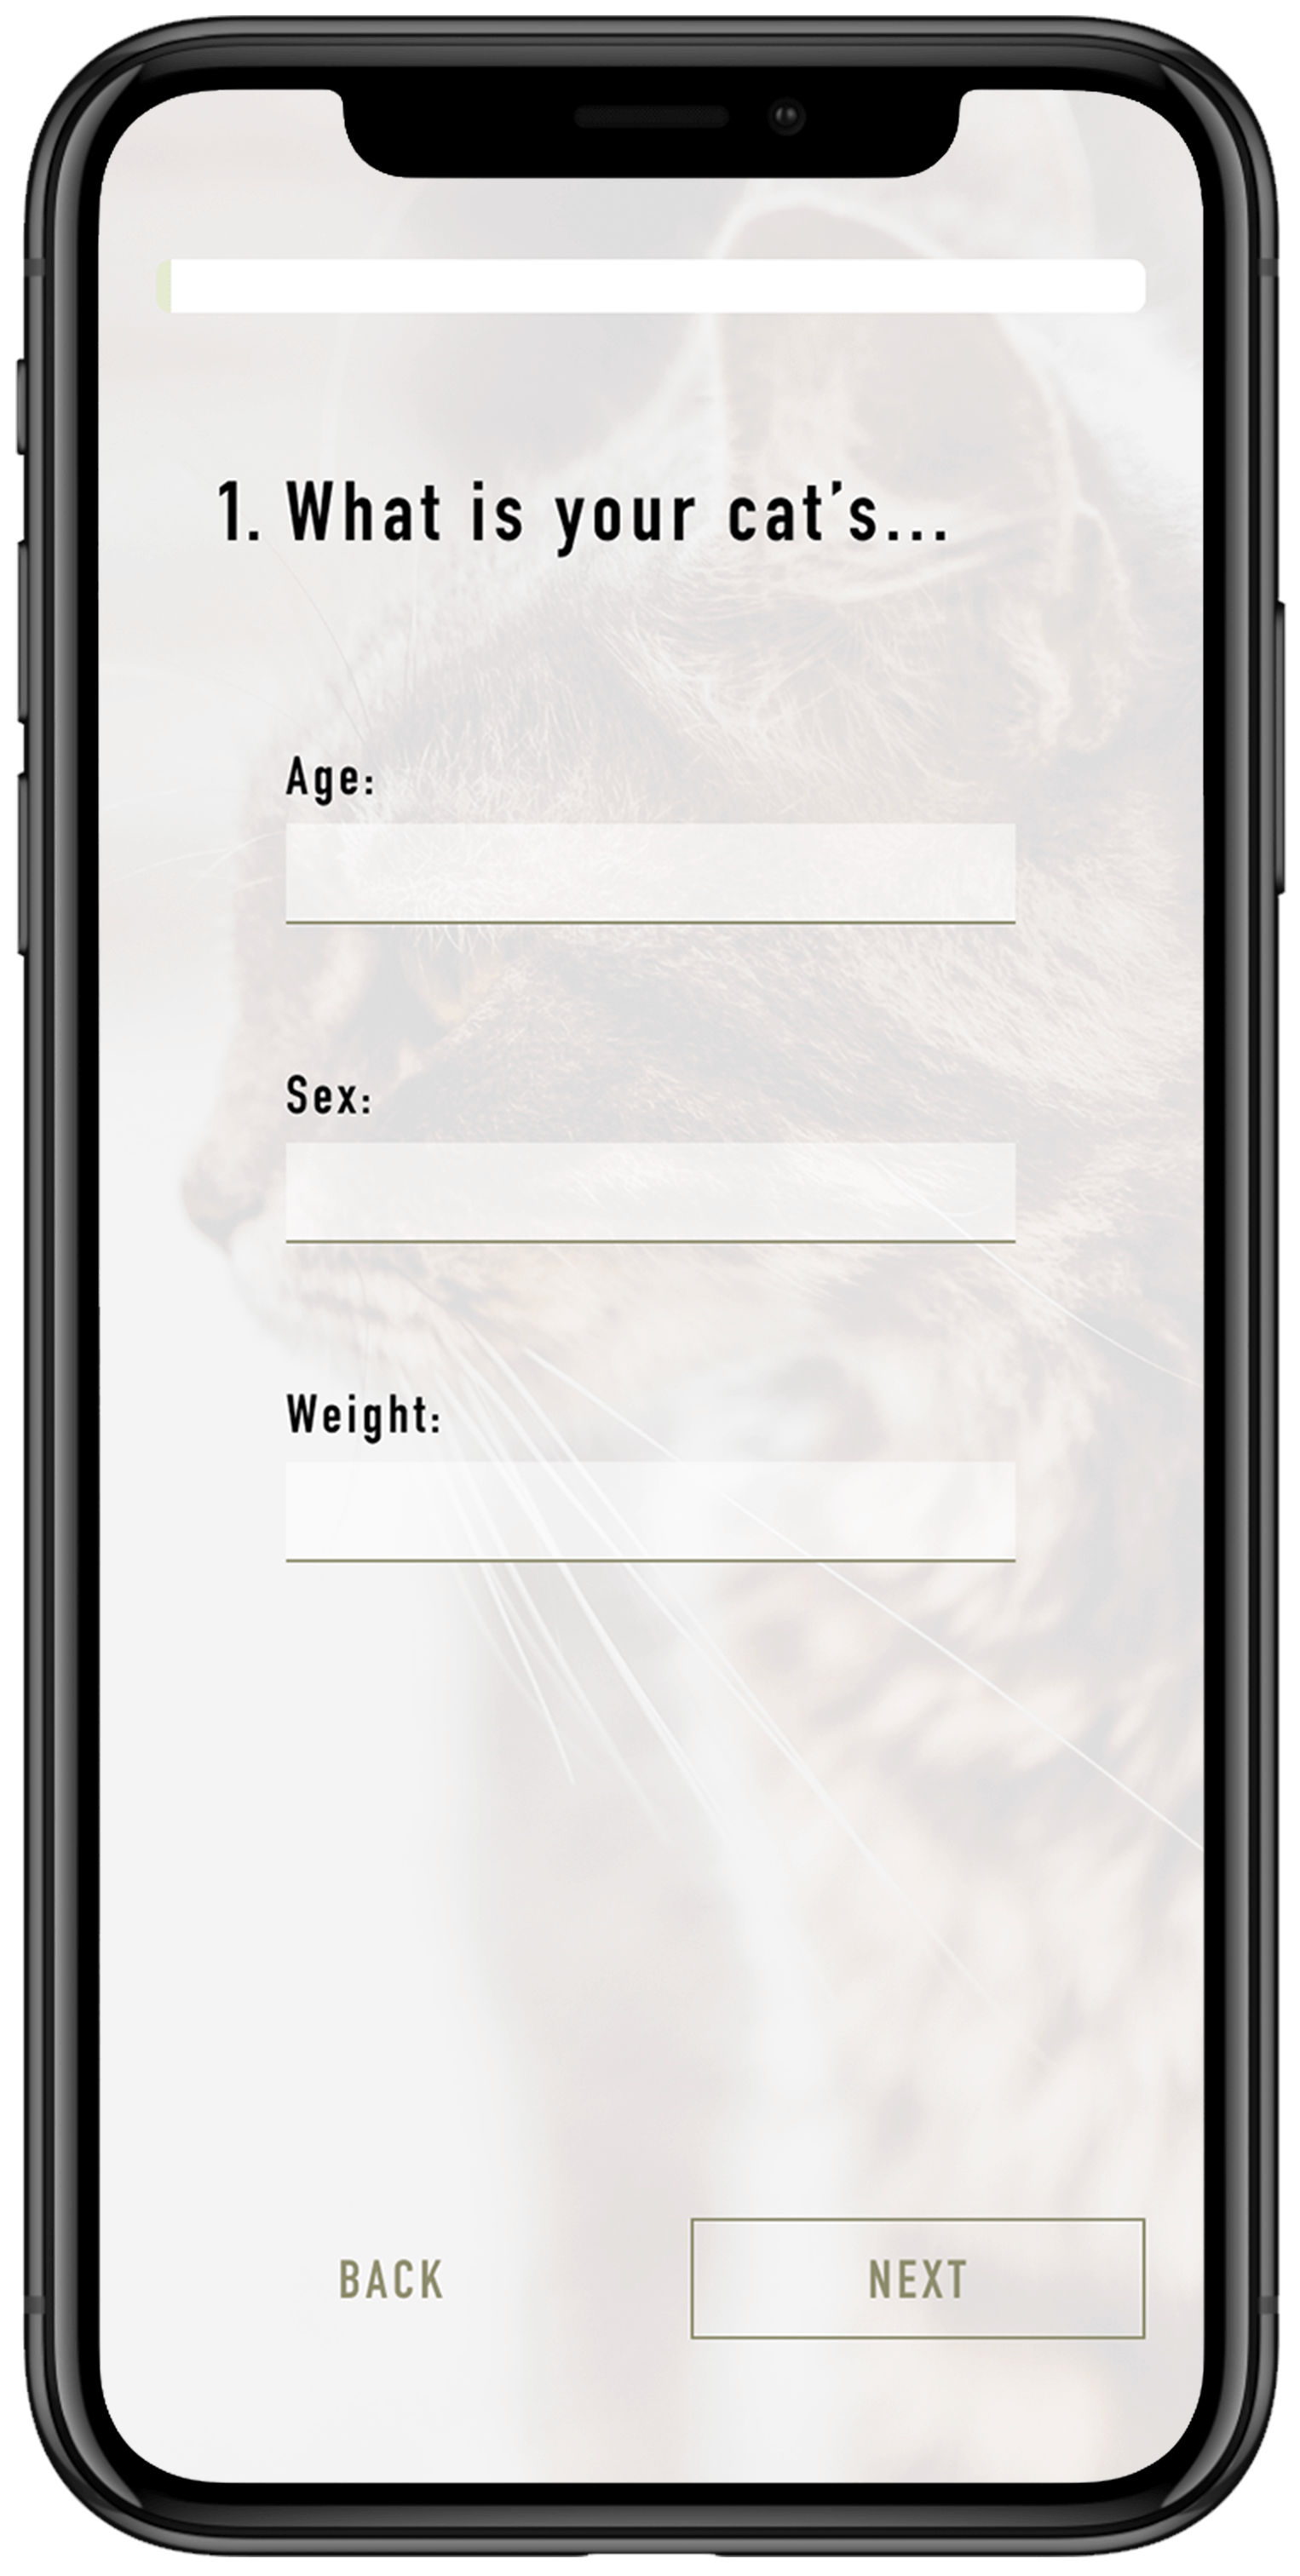
final mockup
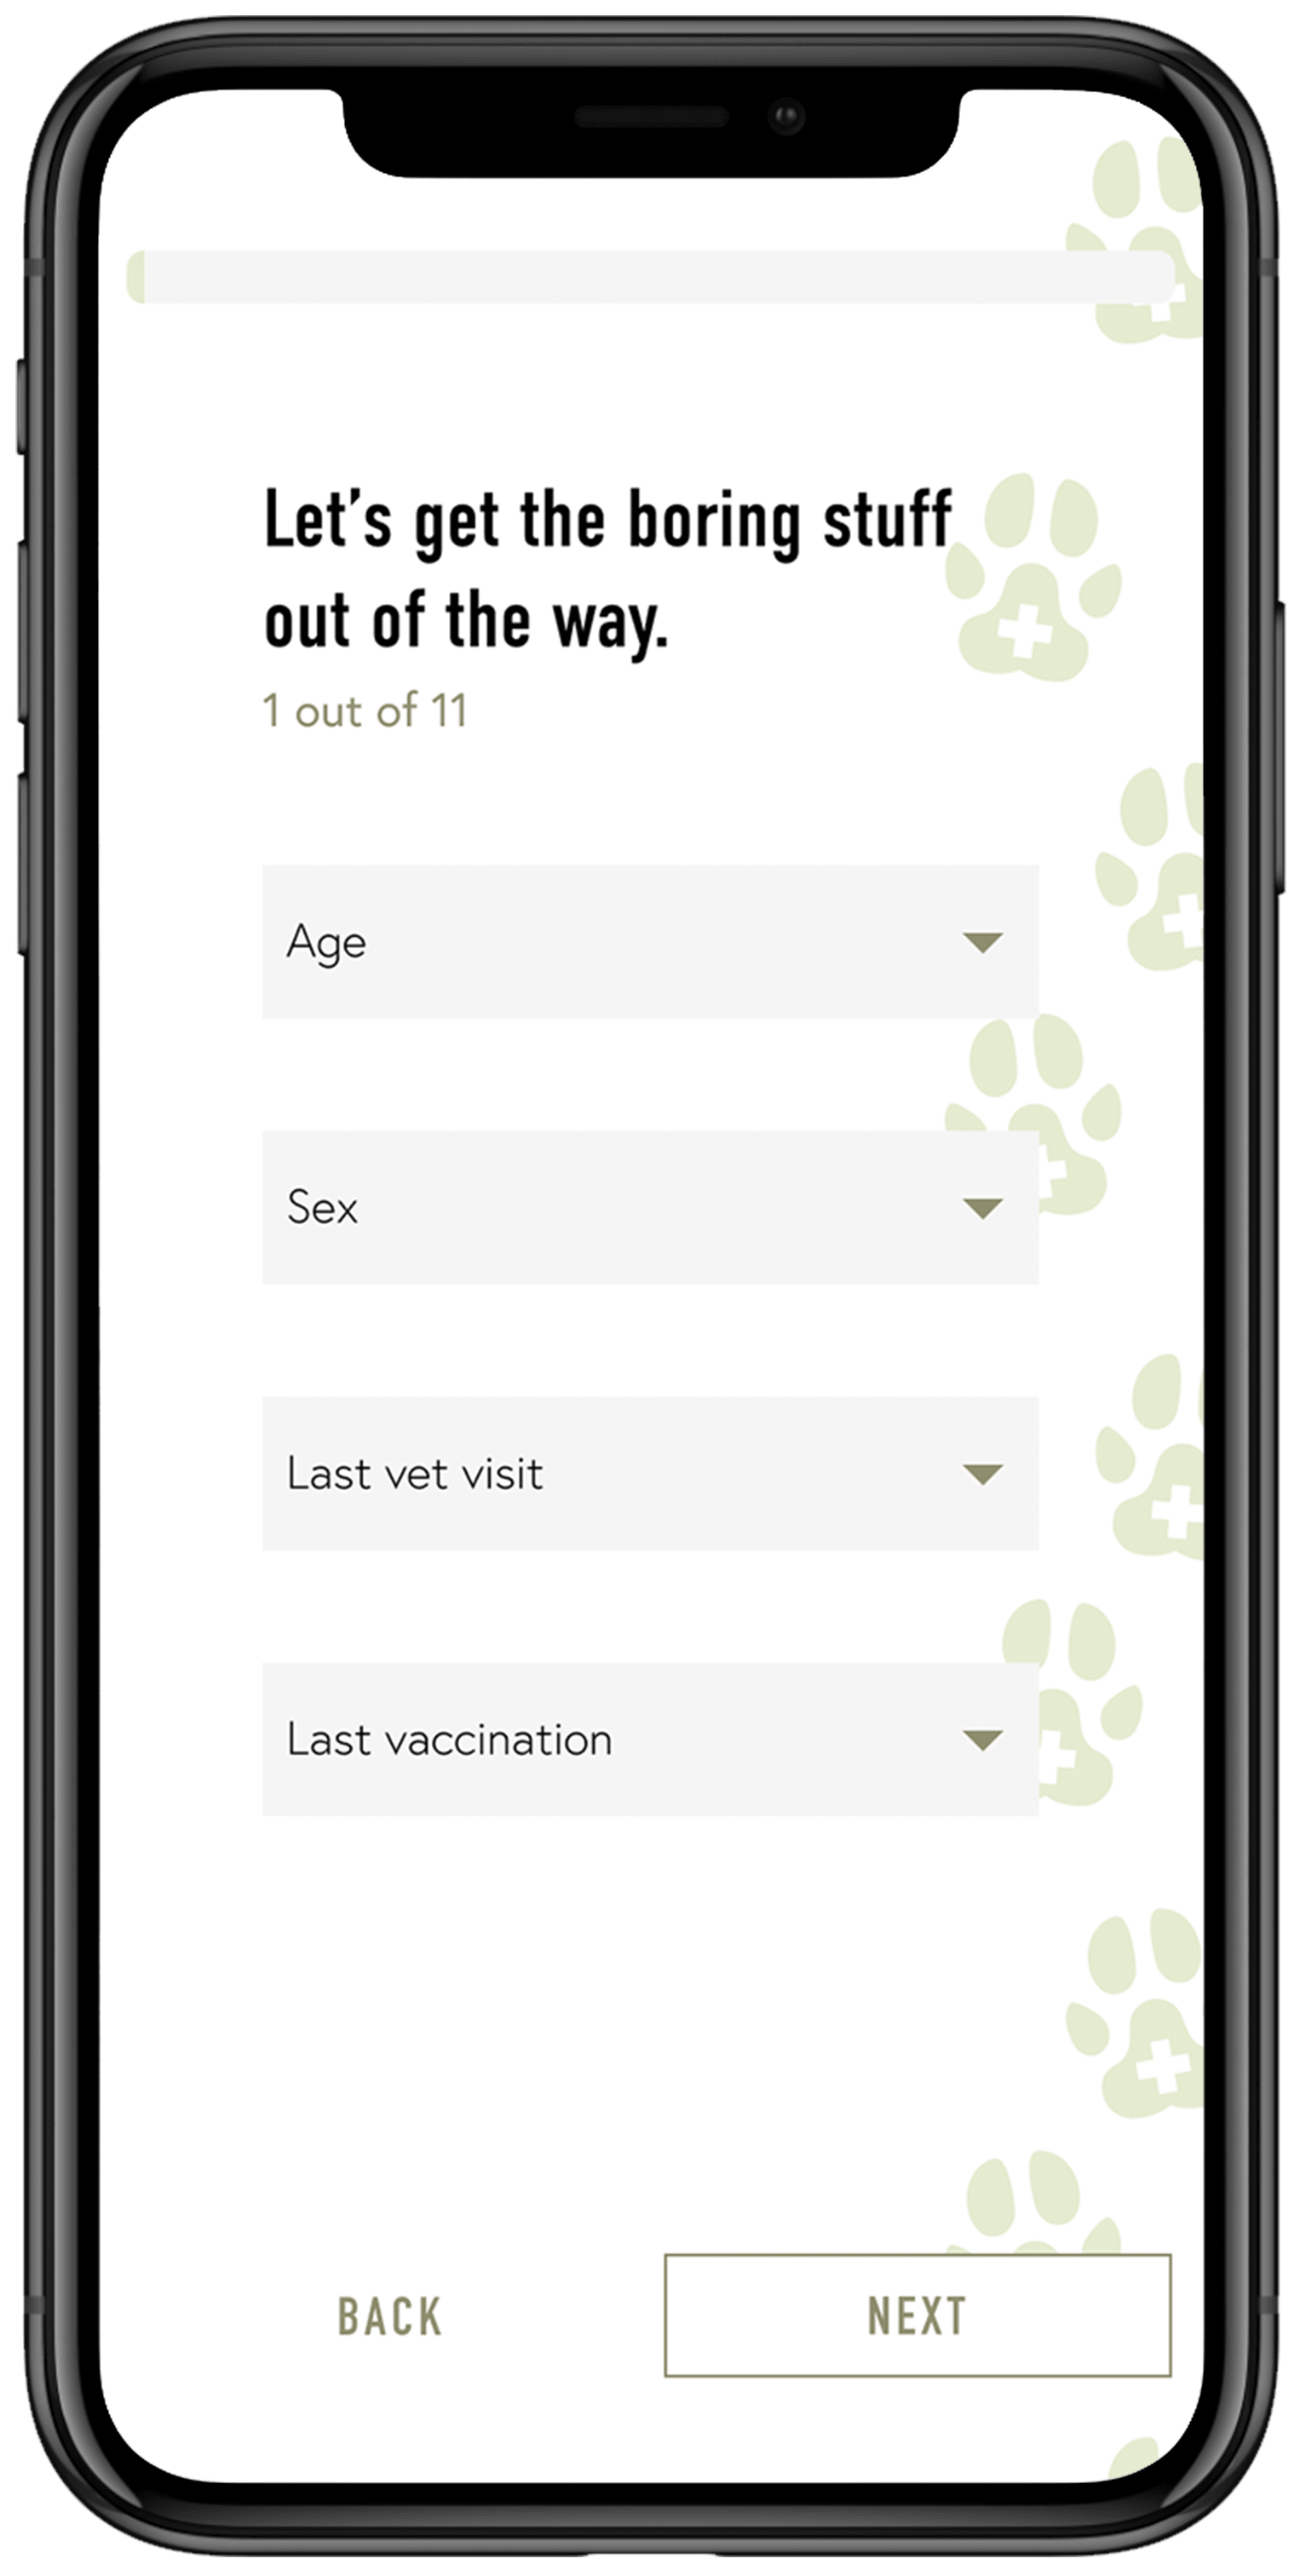
Some info on the above
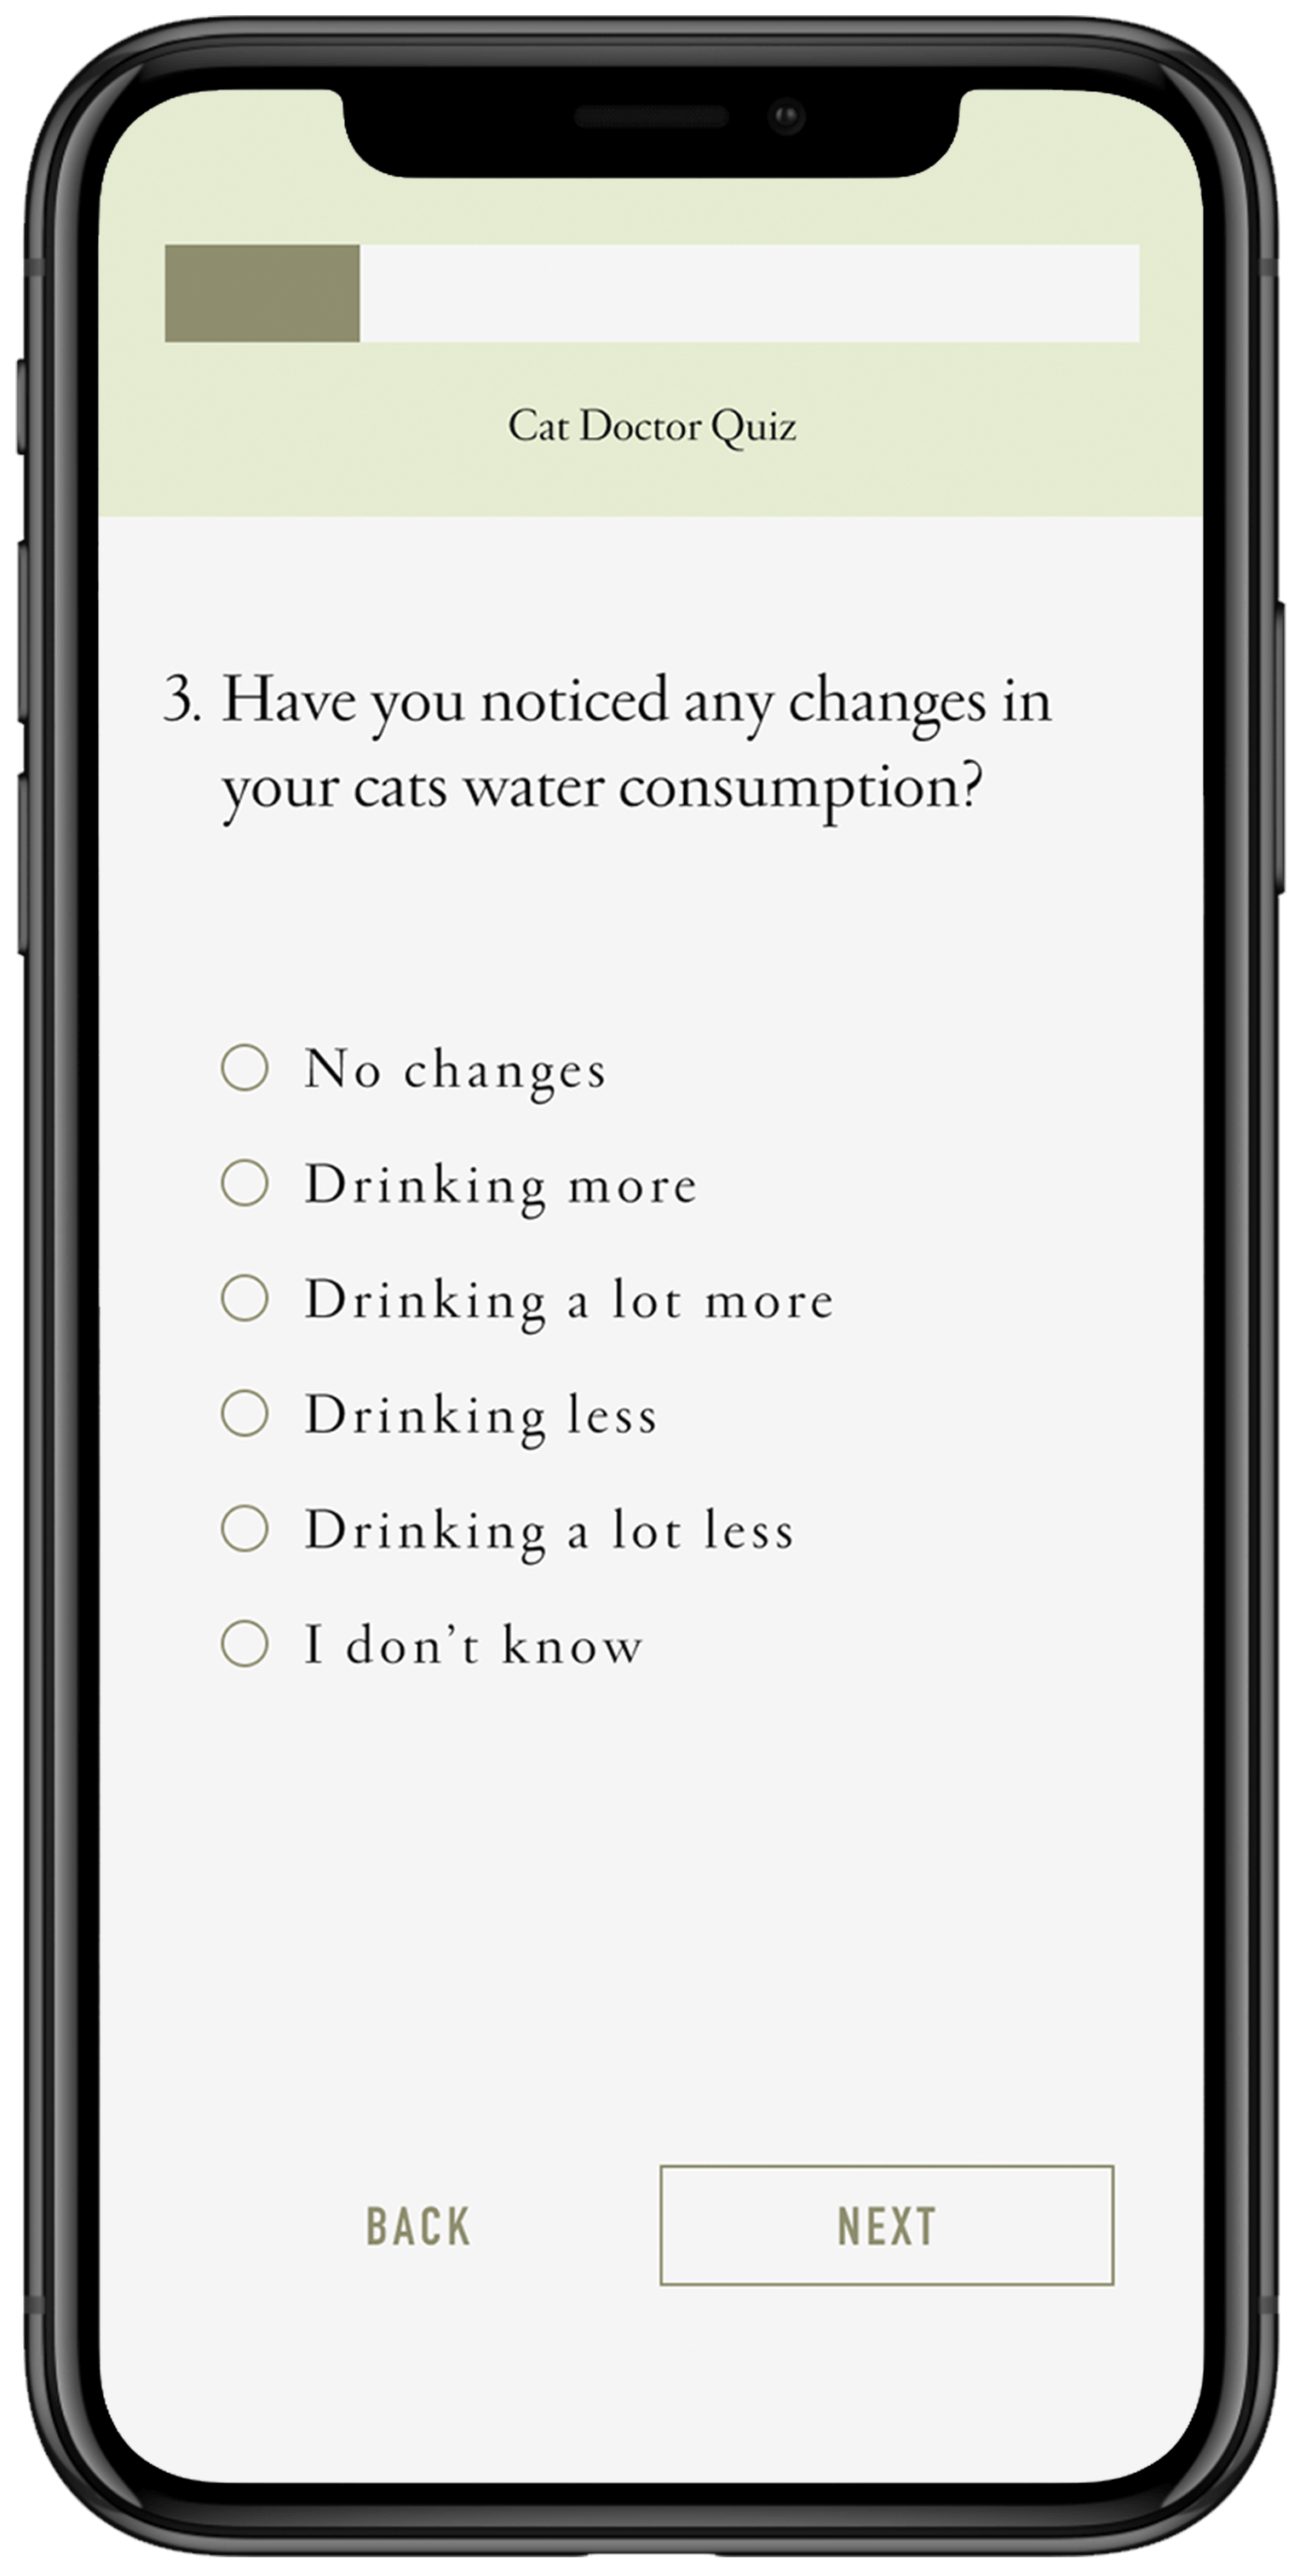
Question 3
wireframe
first mockup

final mockup

Some info on the above
Question 4
wireframe
first mockup
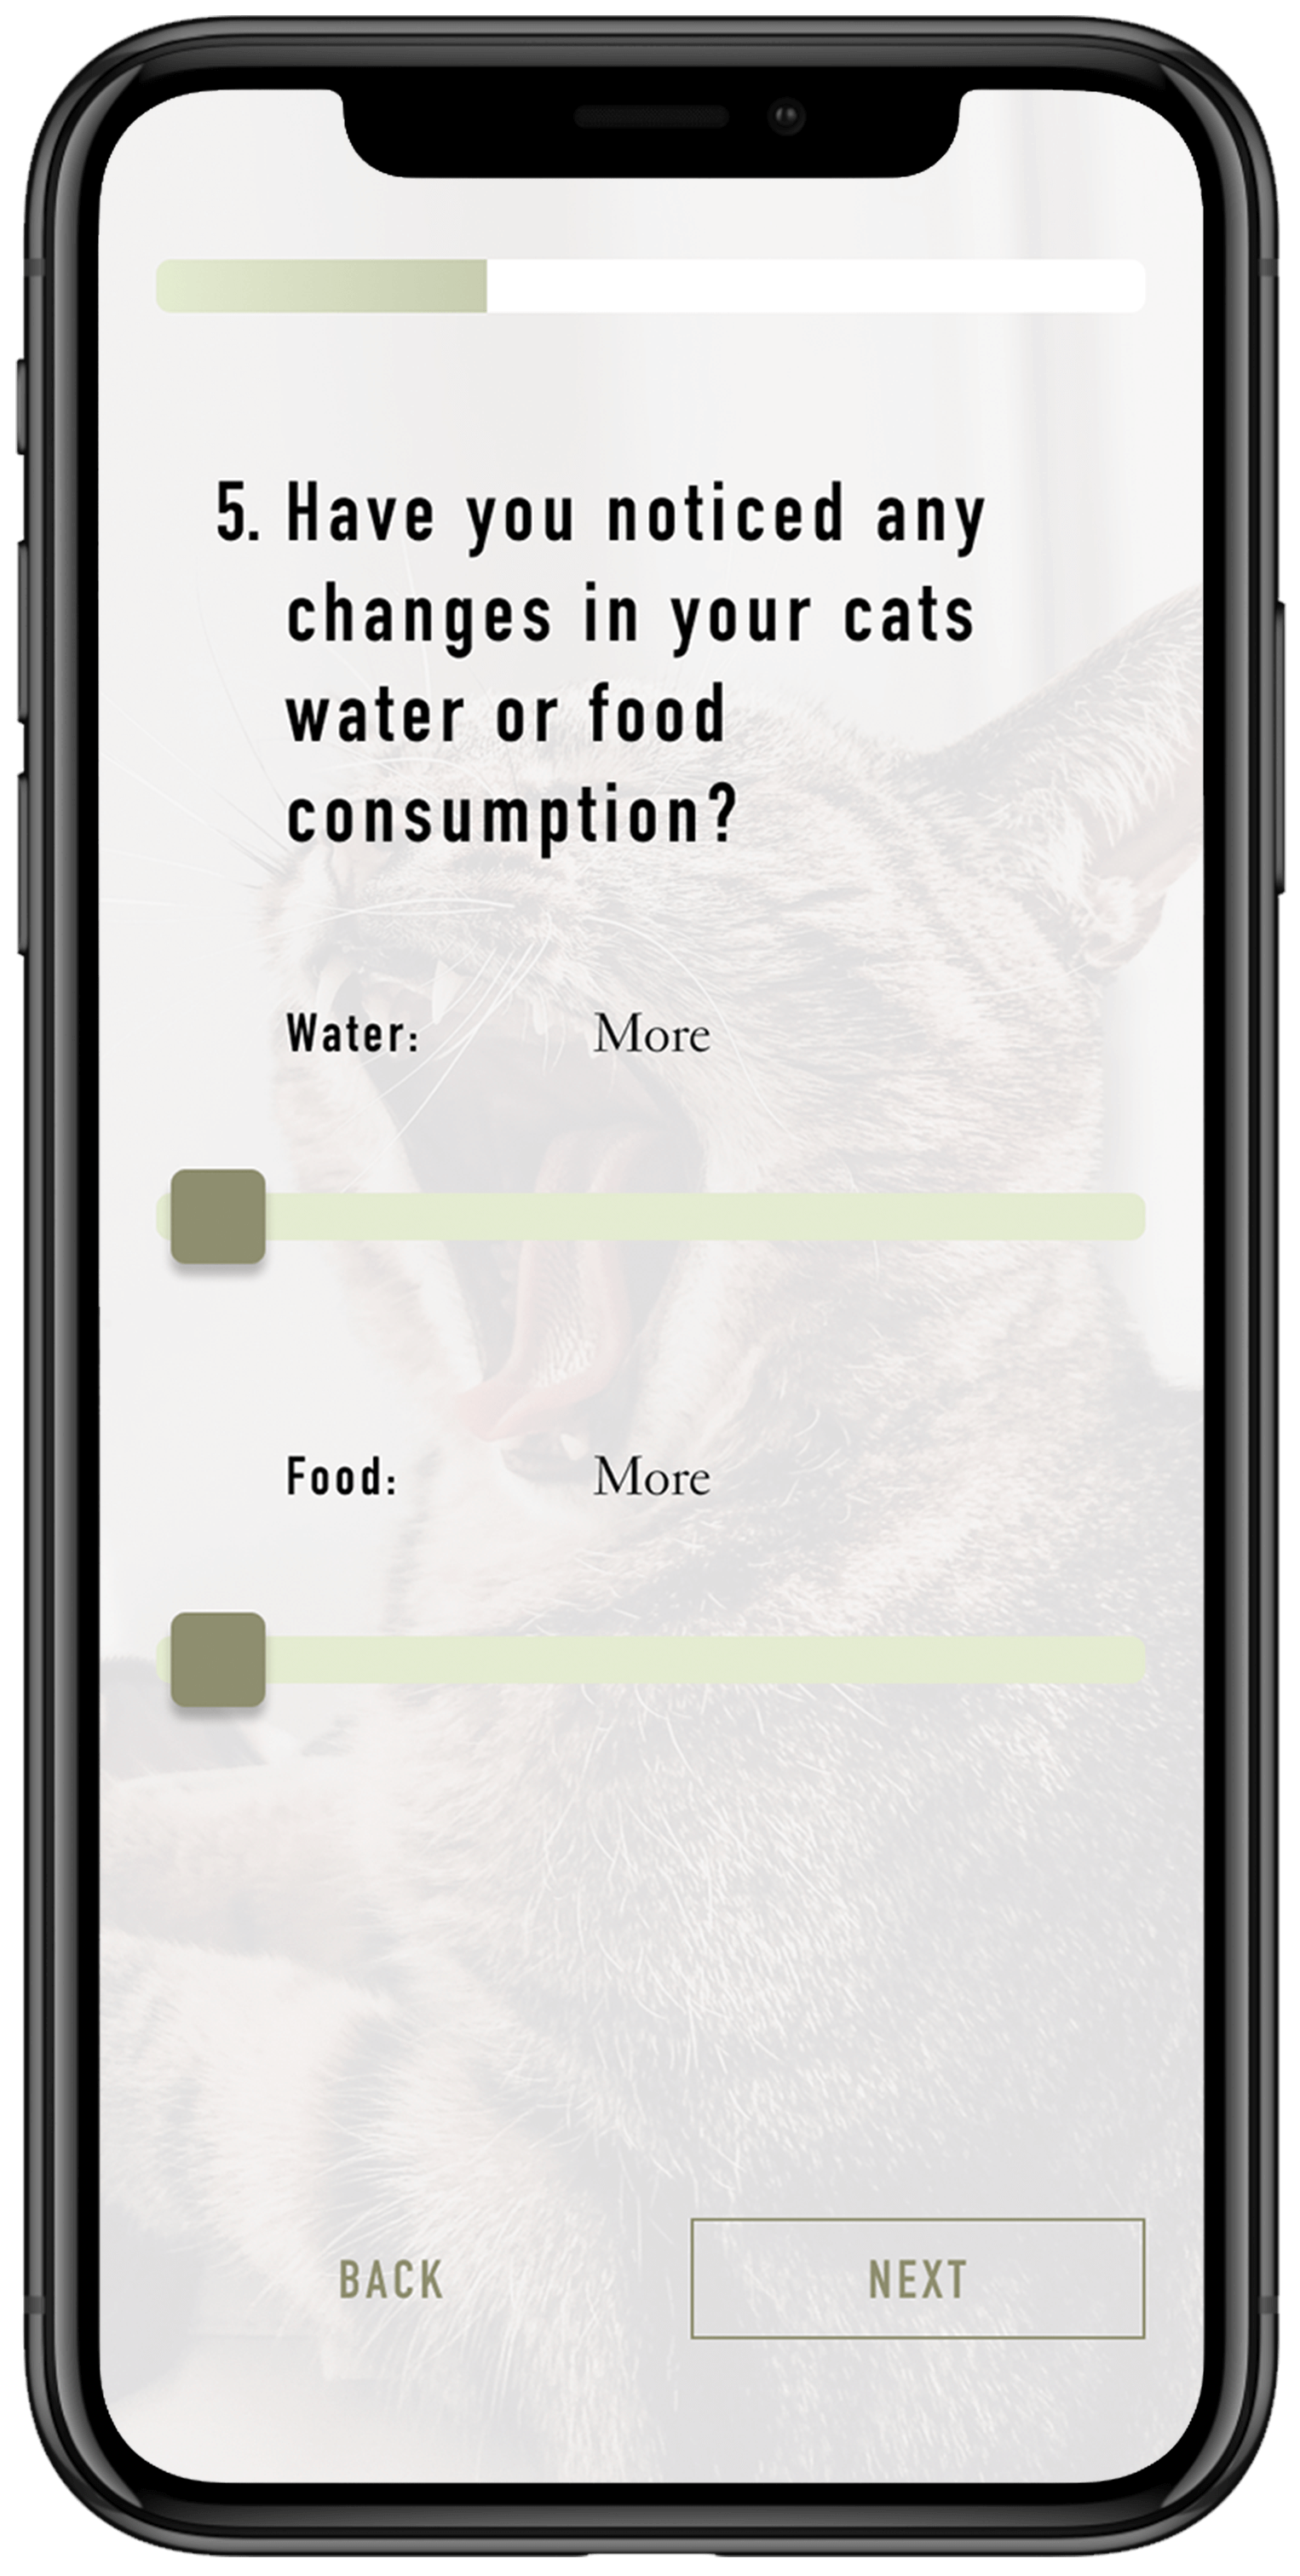
final mockup

Some info on the above
Question 10
wireframe
first mockup

final mockup
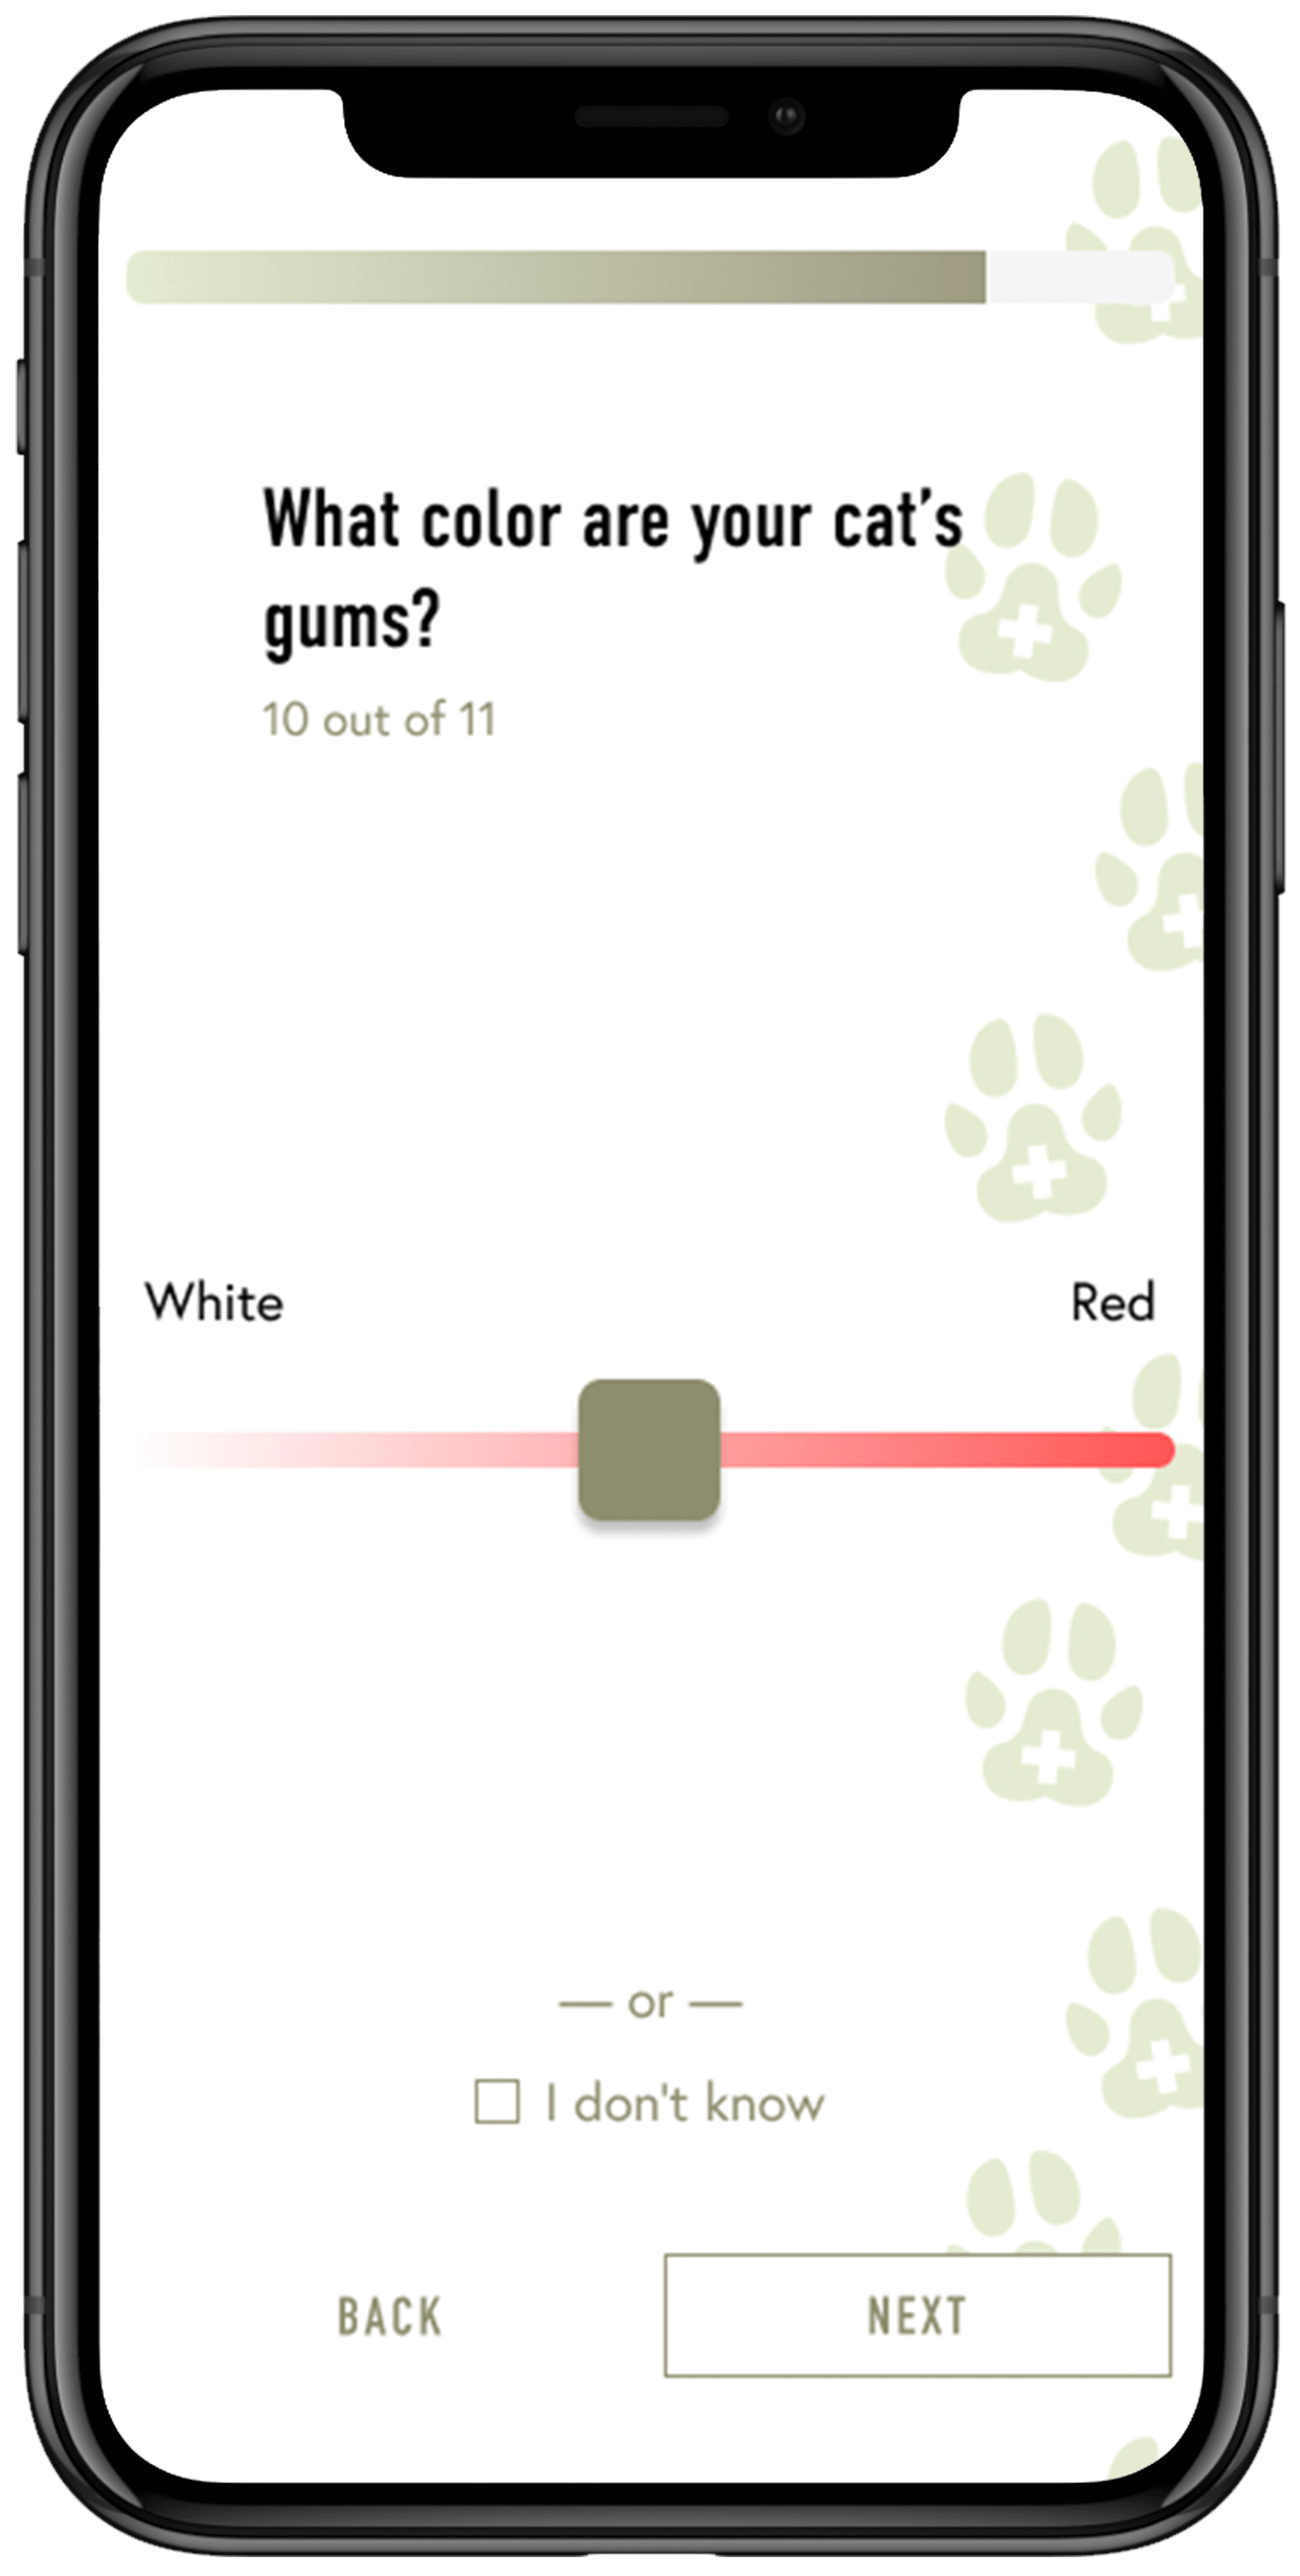
Some info on the above
Overall, my user testing proved the tool made sense. However, it did not prove whether or not people would use it. Since the ideal version would most likely be a time consuming custom build, we opted to test our product further by creating an MVP.
After researching different ways of building a simplified version of our online diagnostic tool, we settled on creating it with Typeform. This allowed us to use sliding scales for answers, and also let us develop a mathematical way of weighing responses. For instance, if a user had more than one alarming answer - such as my cat abruptly started loosing weight and is drinking lots of water - their cat's rating would be "red." Each color has specific explanations and reminds users to check with their veterinarian first before making any decisions.
The 4 possible outcomes of our MVP:
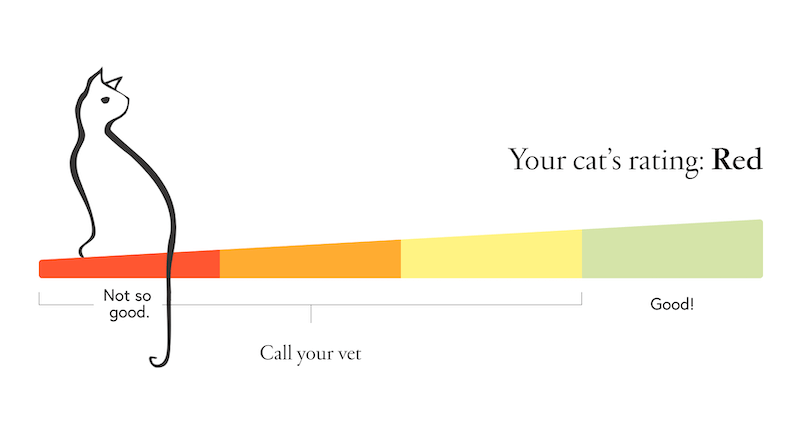
At least 2 of your answers were very concerning. You should consult your veterinarian immediately.
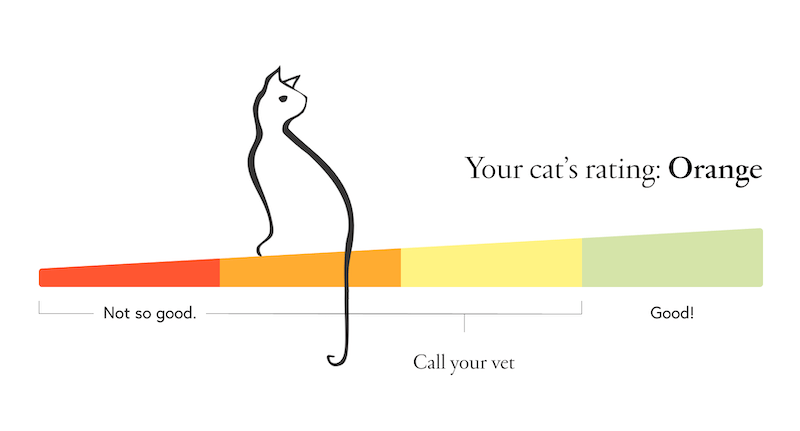
1 of your answers was very concerning, or you had multiple somewhat concerning answers. You should consult your veterinarian as soon as possible.
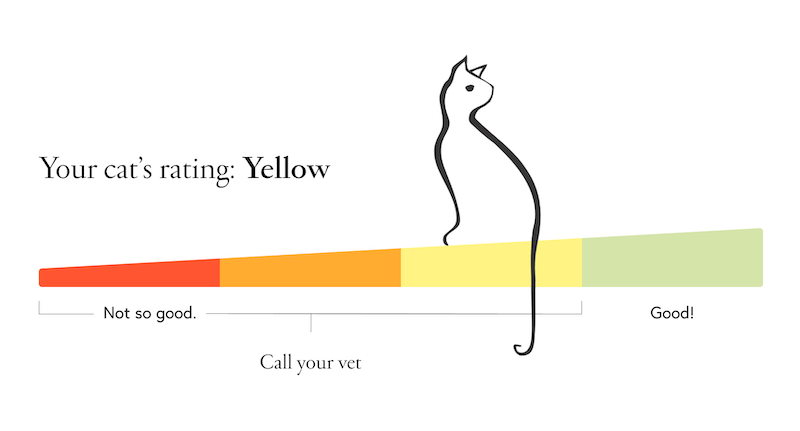
You had 1 slightly concerning answer and you should consult your veterinarian soon.

Your cat's in good shape. Keep up the great work!
Initially, we didn't get many responses. After analyzing hotjar videos of our users interacting with the website, we realized that most of them didn't go below the fold on the homepage. Unfortunately for us, this is where our tool was located. To find a better location, we developed an A/B test using Google Optimize. One version had the tool in the main navigation with the phrase "do I need a vet?," another also had the tool in the main navigation but phrased as "quiz: do I need a vet?," and our baseline version had neither. Our goals were to see which one made people call the most, which one made people make the most appointments, and which one got people to use the tool.
We ran the test for 6 weeks. During this time, we noticed a 12% bump in current clients coming back. While we also got more responses, the tool still did not get as much traction as we expected. Oddly enough, the version that received the most appointment requests was "quiz: do I need a vet?" It did not, however, make people use the tool the most.
We had plans to continue testing and iterating on our tool but it was cut short by COVID-19.
Before COVID-19 hit and while A/B testing our diagnostic tool, we began designing a nutrition program specifically for overweight and obese cats. This program, led by a vet tech at the Cat Doctor who specializes in nutrition, was in the early stages of development and already had a couple clients interested. After we interviewed her and reviewed the current handouts, I created the journey map below. This details current client responsibilities vs Cat Doctor responsibilities and current client pain points vs Cat Doctor opportunities.
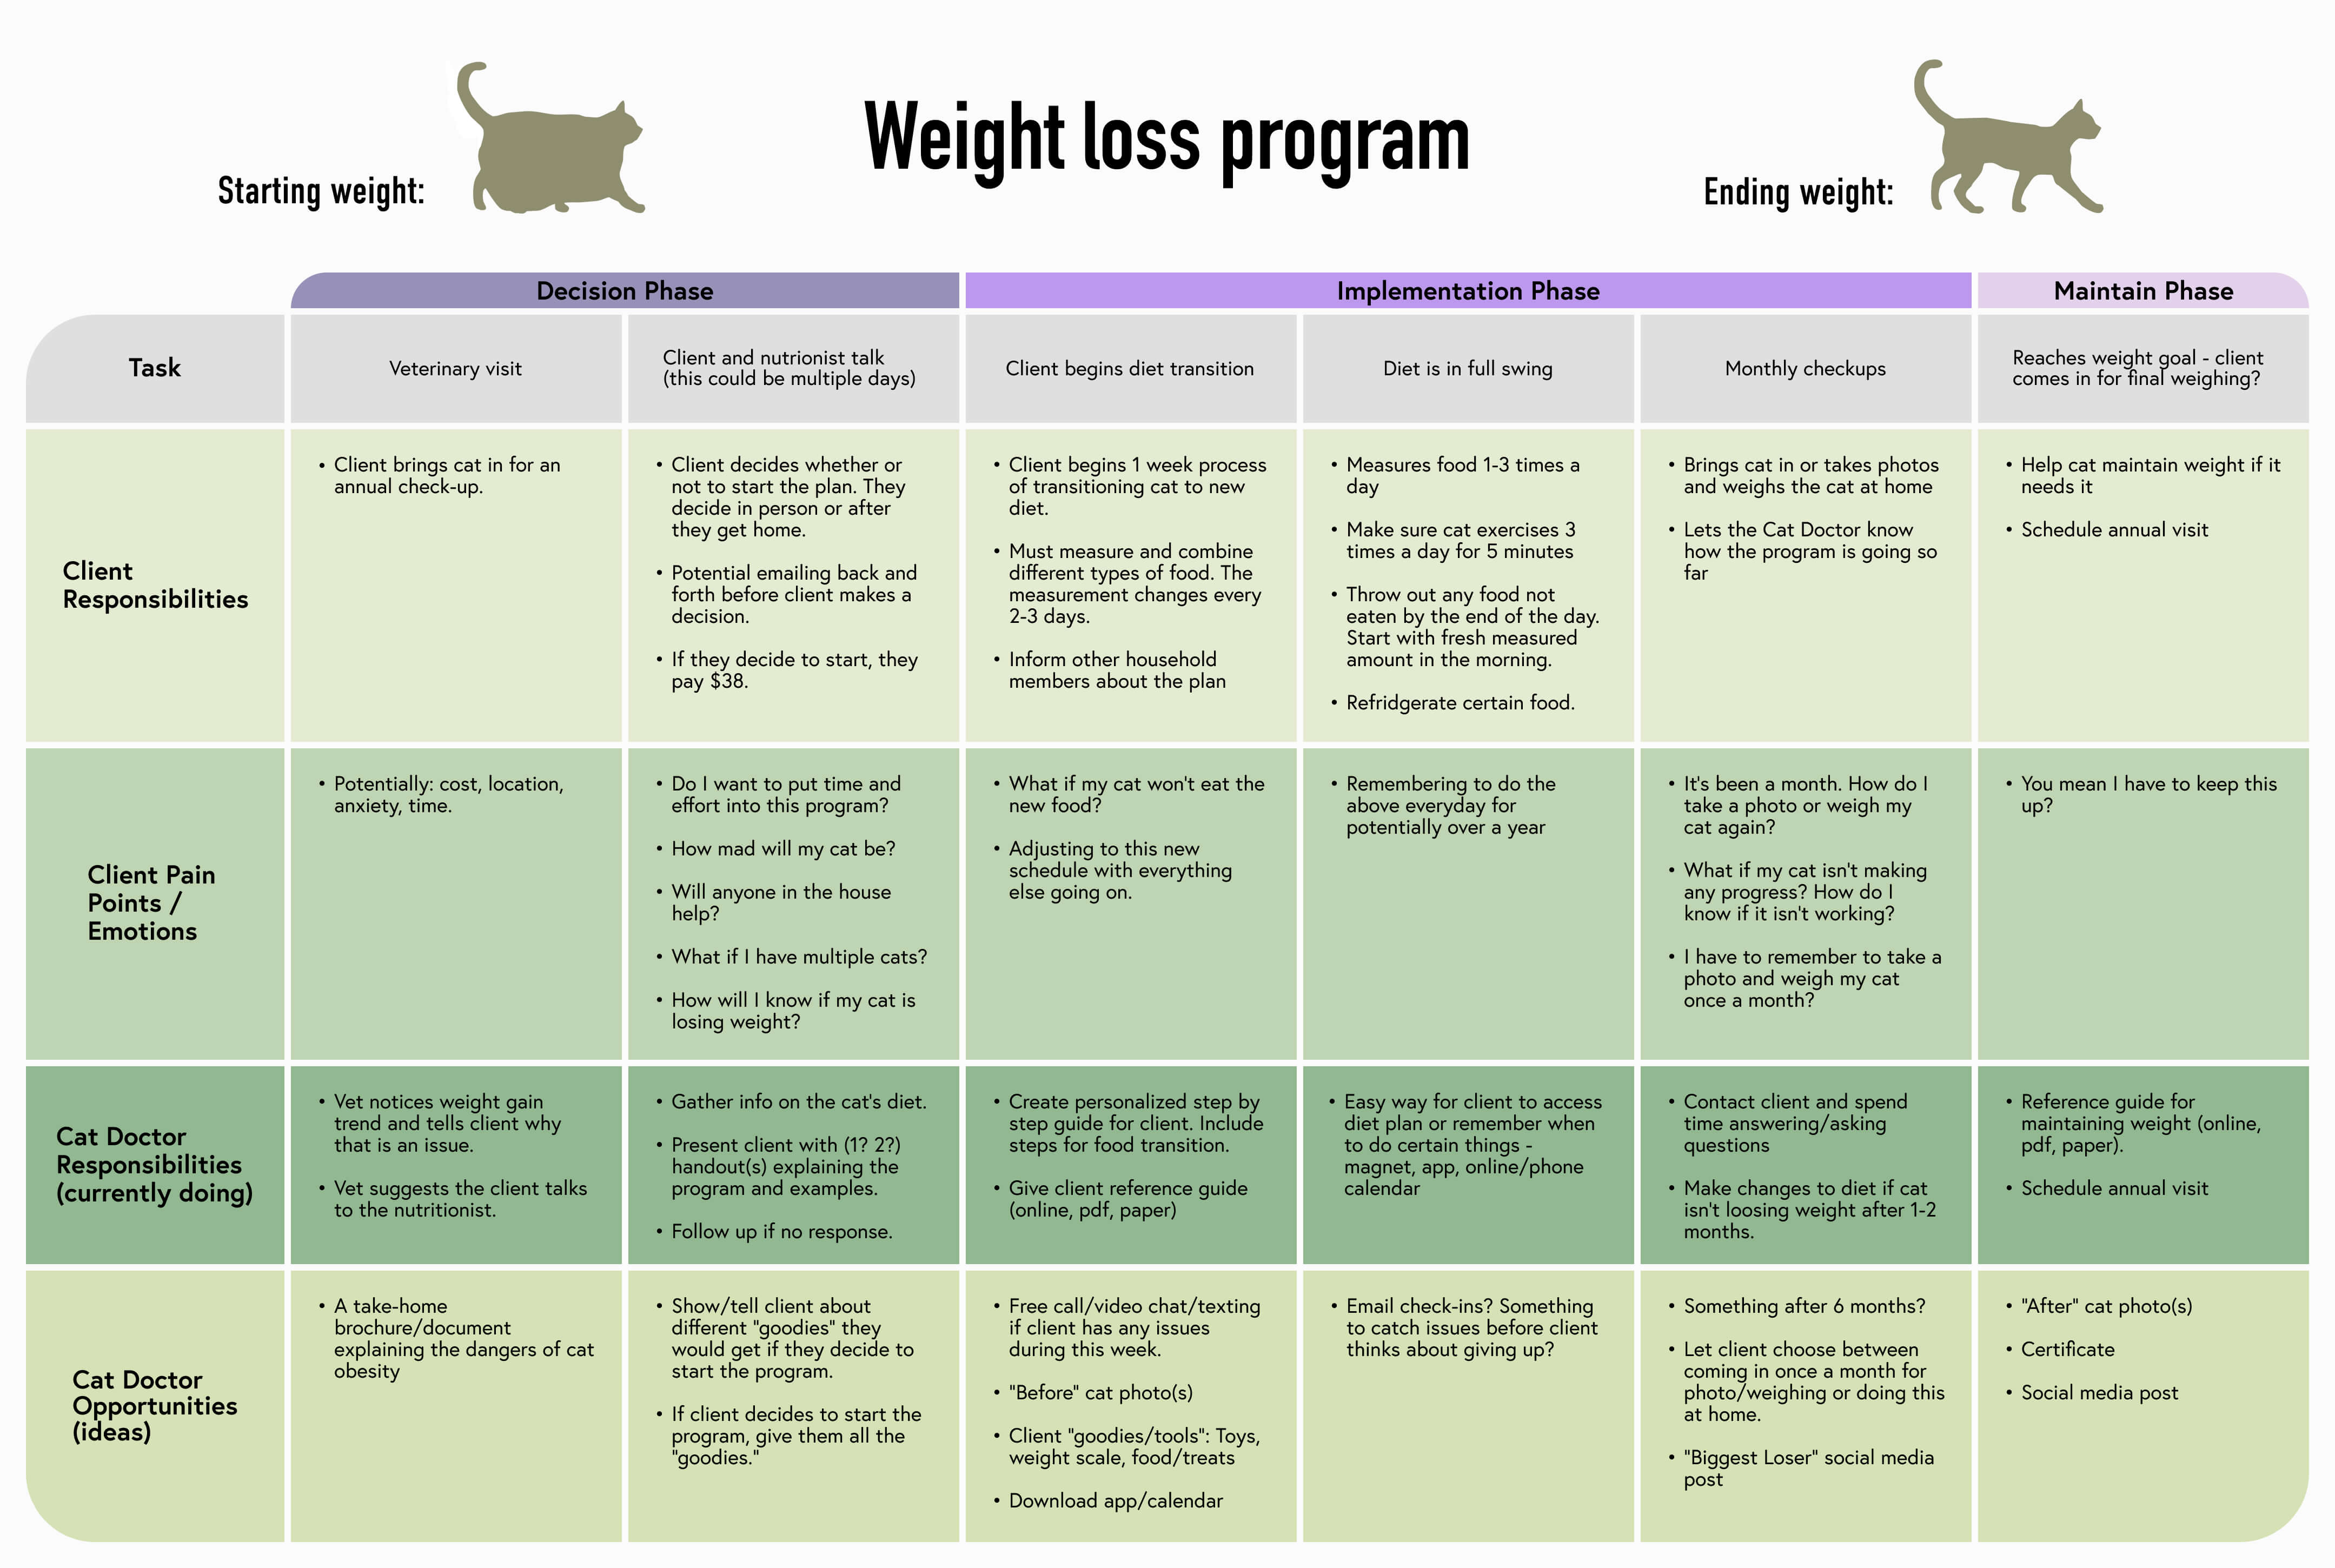
At the time, clients received a 3 page packet of information when they signed up for the program. The packet contained details about the benefits of weight loss (in cats specifically), how the program works, how long it could take, various tips & tricks, diet options, and more.
Referencing our personas and my new journey map, we began theorizing what receiving all this information might be like for the client. We imagined that it would be stressful to have to change your cat's diet (which some cats hate!), commit to a specific and indefinite feeding schedule, and remember to do this everyday, all on top of everything else going on in their lives.
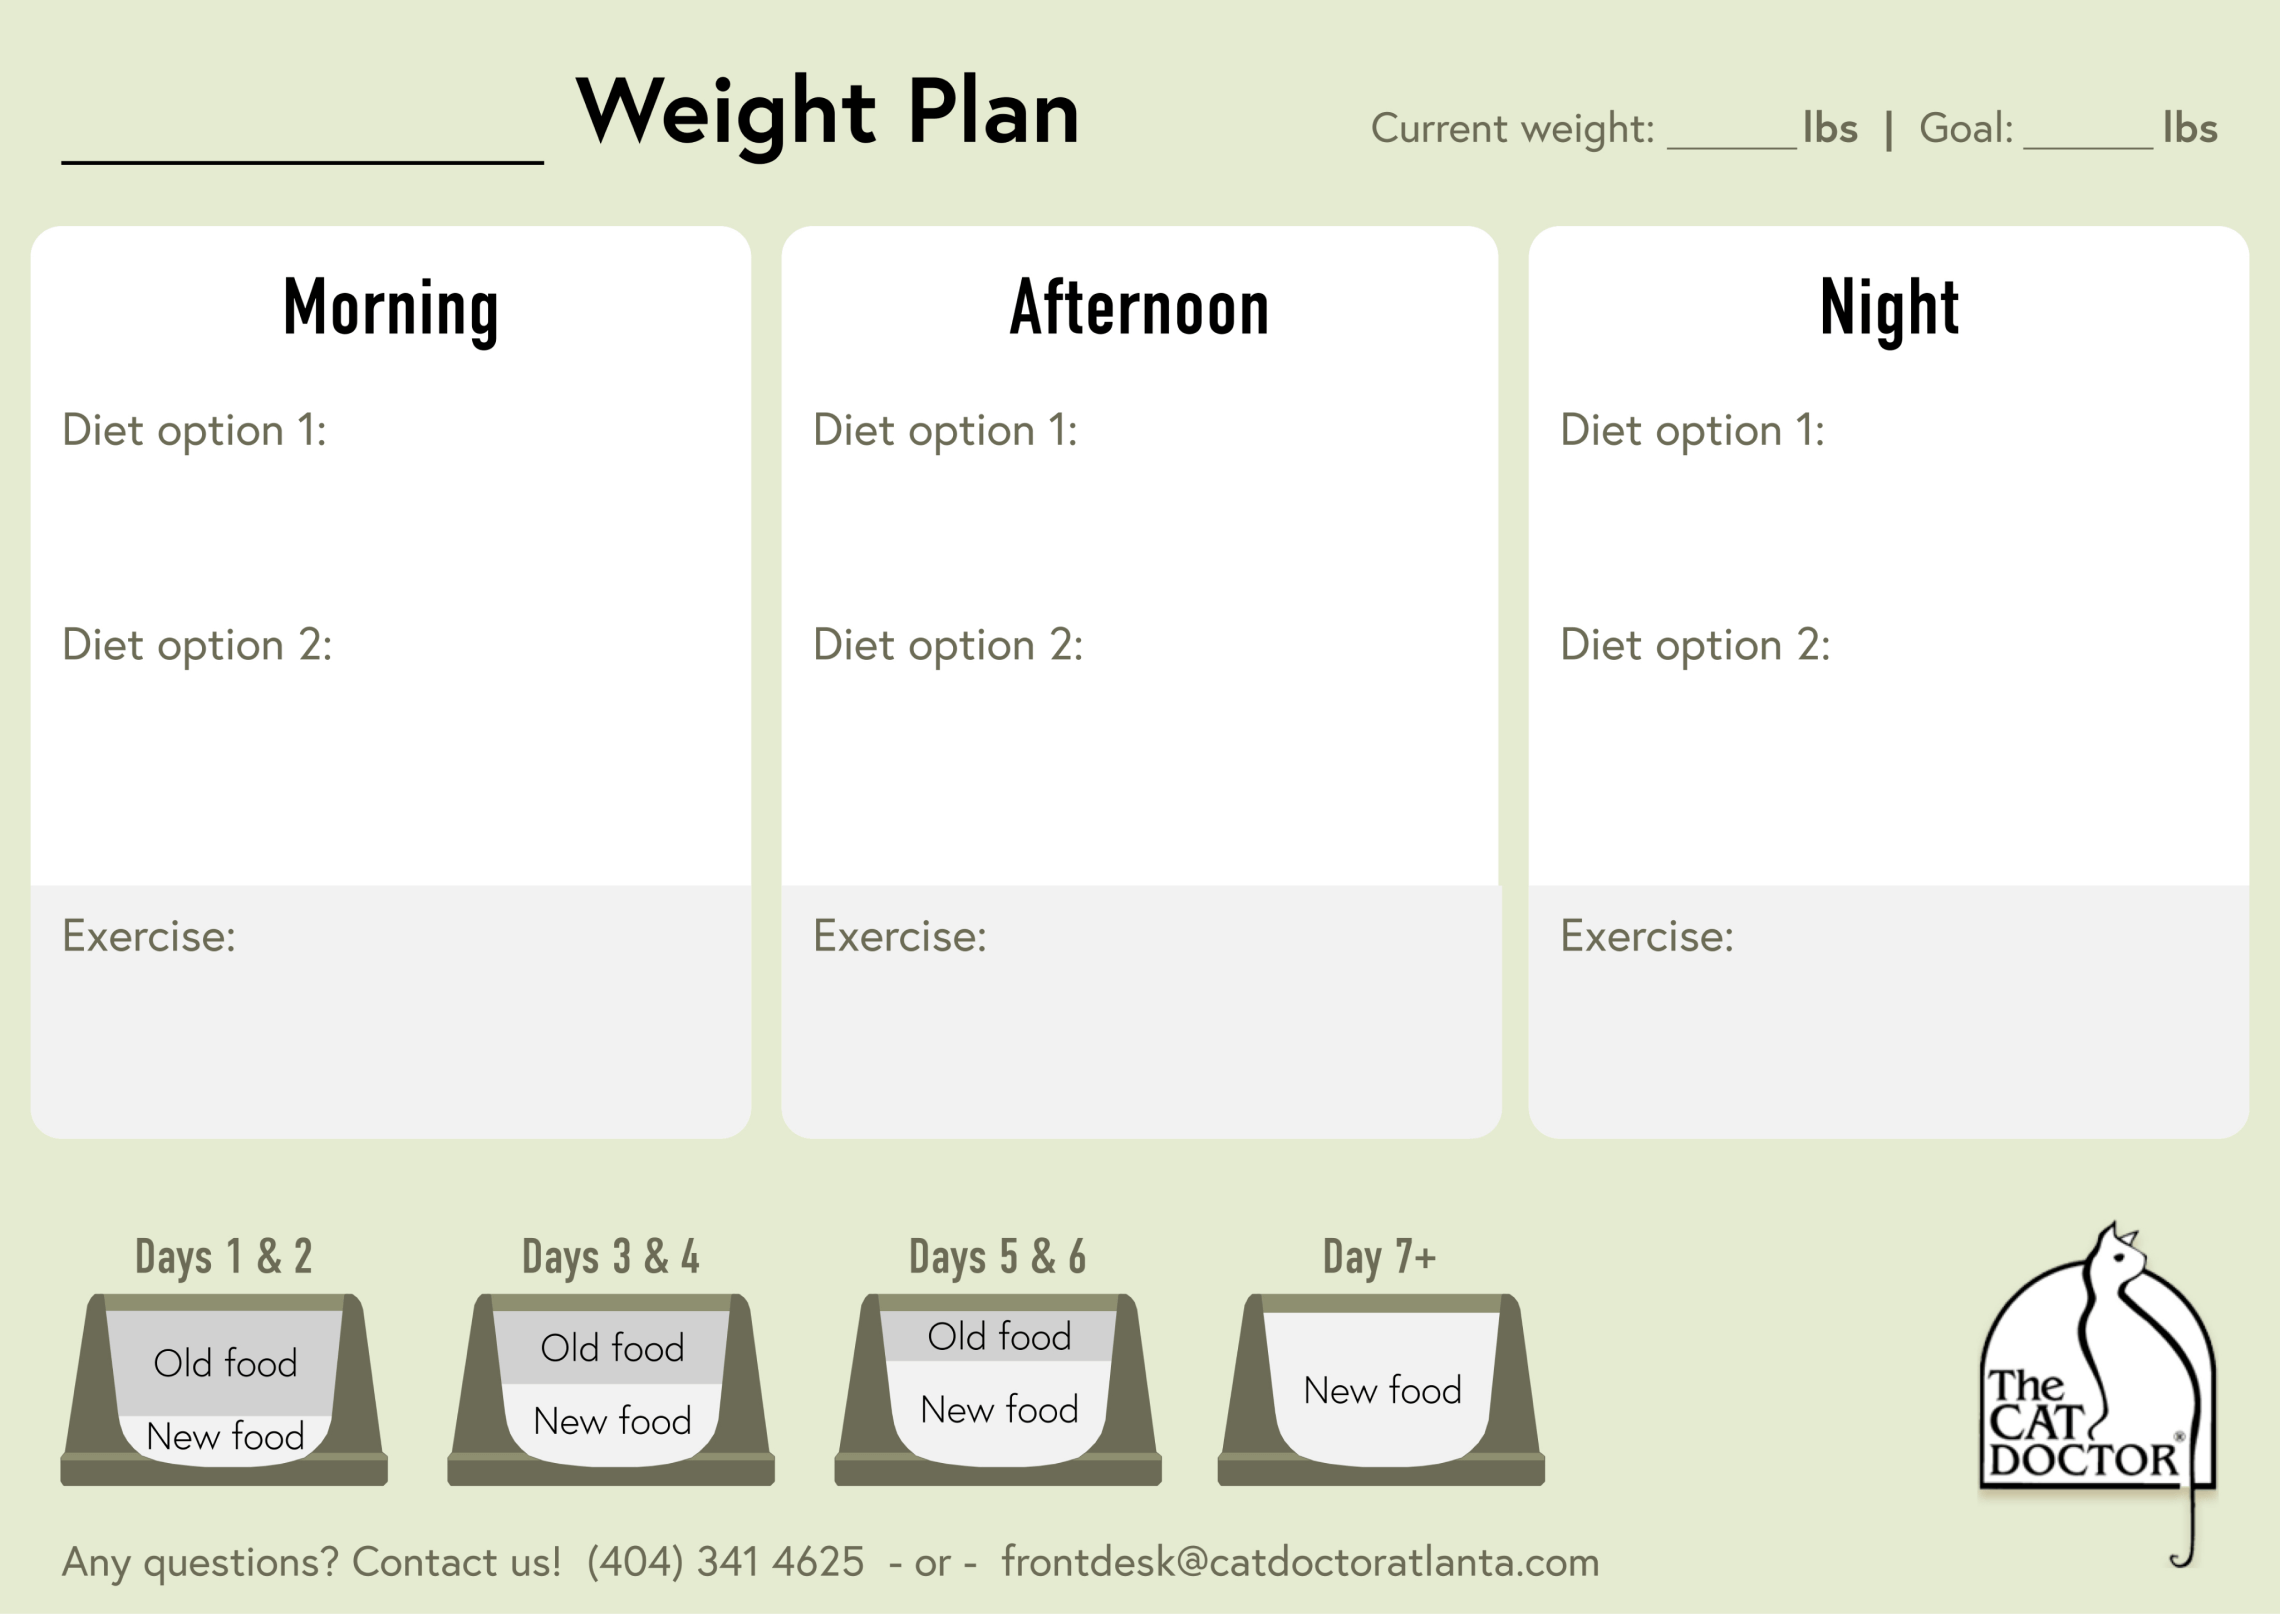
For us, the question became: How can we simplify and visualize this information in a way that makes it more impactful and easier to follow?
The first step was extracting the most important information: The new diet schedule. Below is what clients are now handed - a 1/2 page document with a personalized schedule.
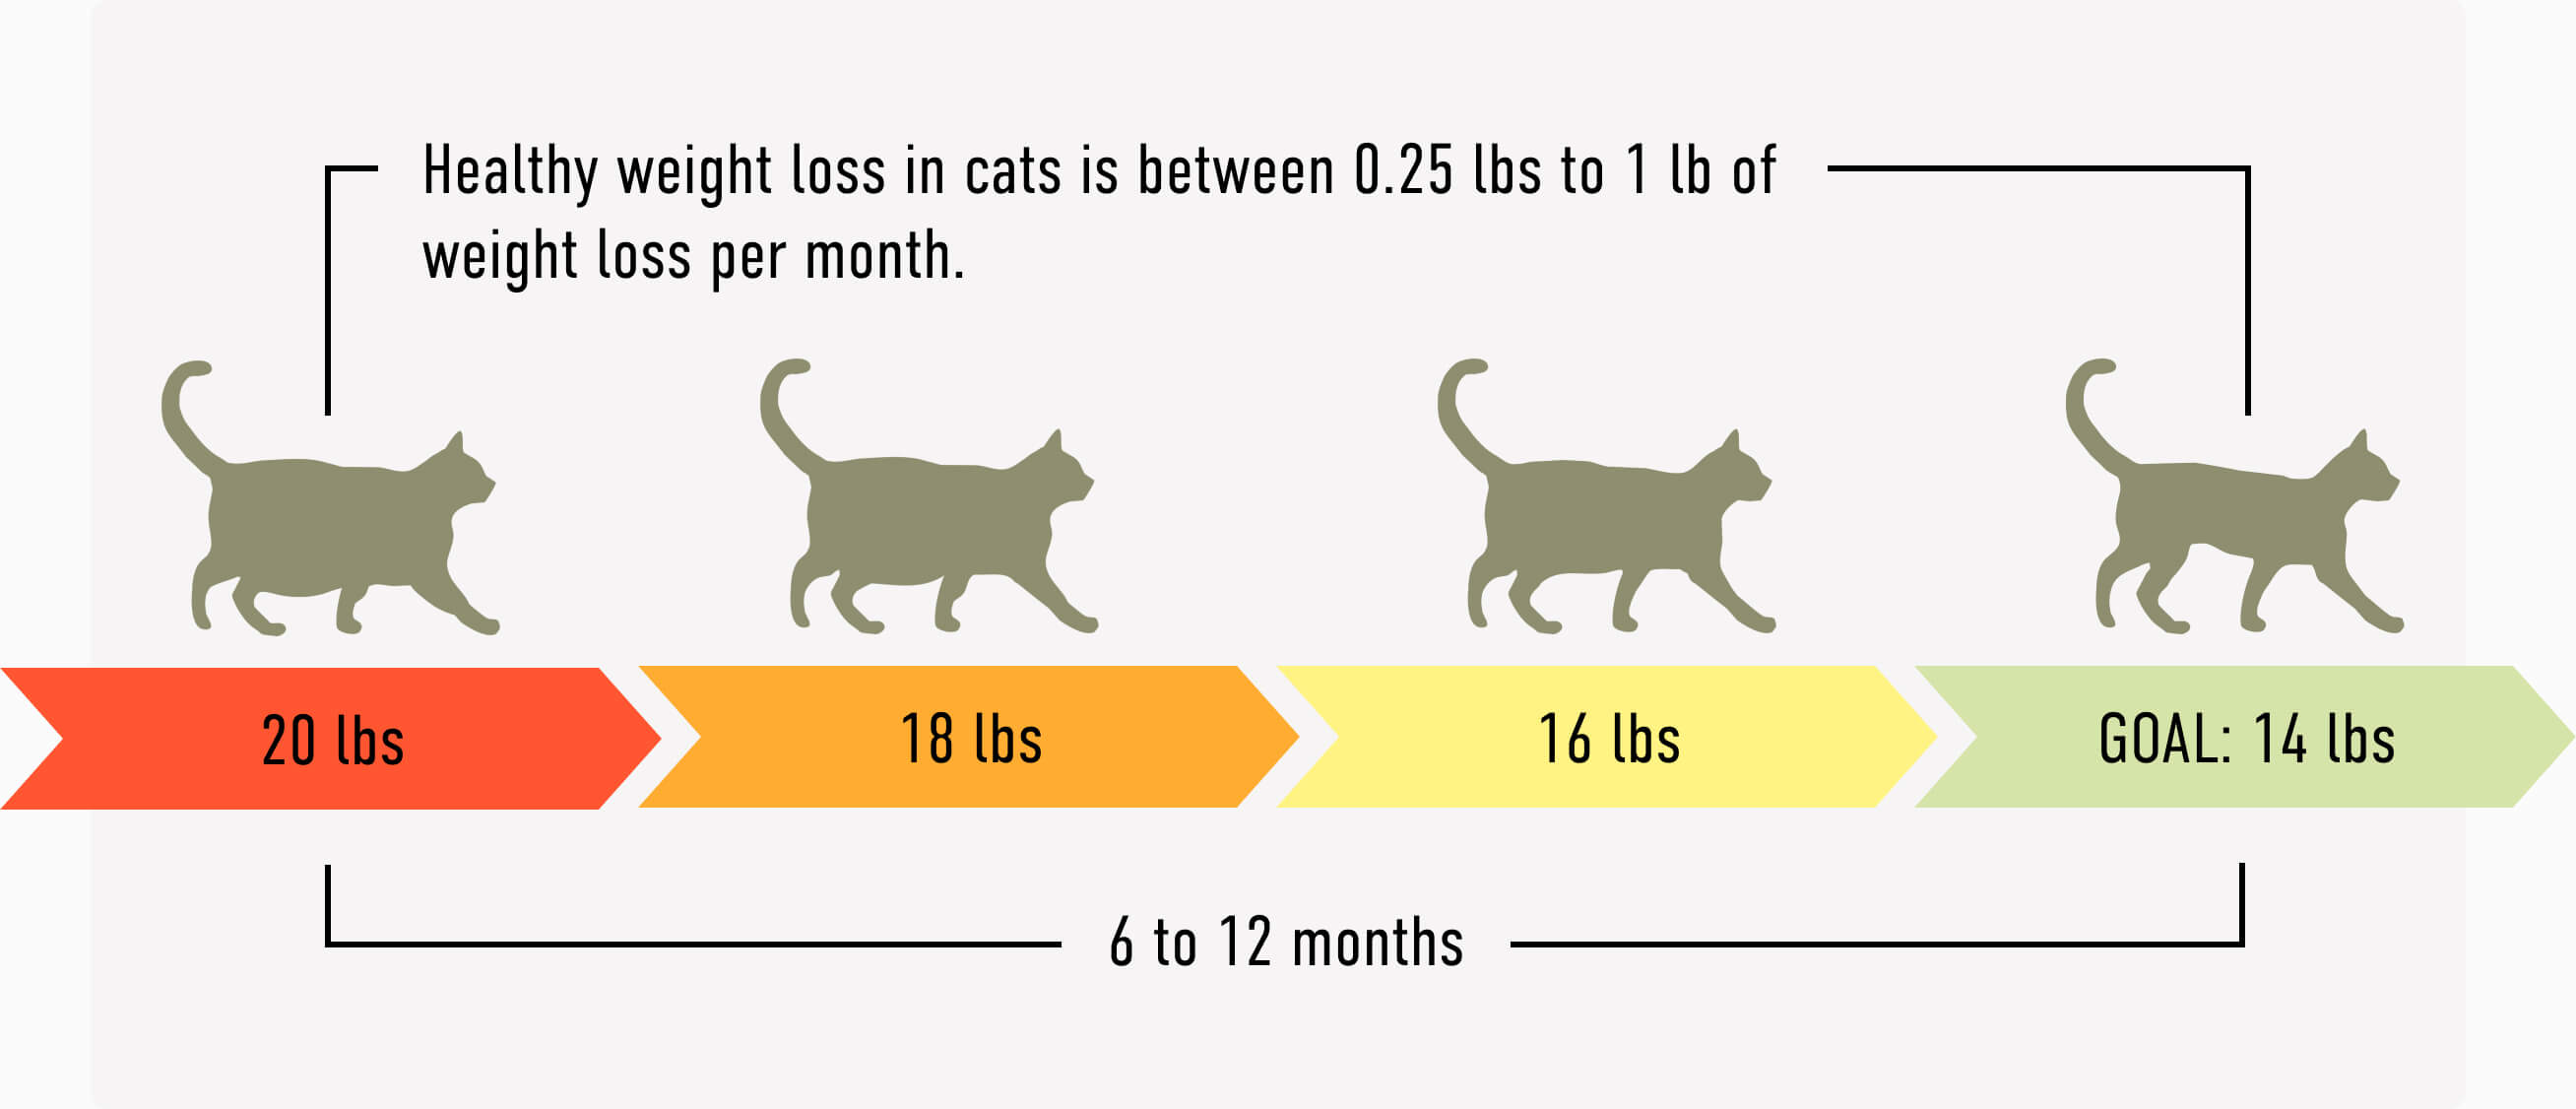
Here is an example of a diagram I created which visualizes the nutrition plan timeline.
I believe there are more opportunities to create impactful visualizations of the information in the initial nutrition plan packet (such as diet plans in a multi-cat household), however, this is as far as we got when COVID-19 hit. To keep up, the Cat Doctor pivoted to telemedicine and curbside visits.
- Finish developing the nutrition program.
- Telemedicine.
- The veterinary world and IoT?